

This article is an on-site version of our Unhedged newsletter. Sign up here to get the newsletter sent straight to your inbox every weekday
Good morning. Jay Powell told Congress yesterday that a recession is “certainly a possibility”, while Bill Dudley, never one to mince words, wrote that one is “inevitable” in the next year or so. Yields and oil fell hard, which feels very recession-y. Stocks, a day after rallying for no reason, held steady, also for no apparent reason. If you can make sense of it, write to us: robert.armstrong@ft.com and ethan.wu@ft.com.
Also, listen to Rob talk about the Federal Reserve breaking things.
The supply side isn’t coming to the rescue
The Fed doesn’t want to tighten the economy into a recession, but unless inflation starts cooling down fast, it’s prepared to do so. The Fed, alas, cannot create new sources of supply or unclog supply chains. It only controls monetary policy, which slows inflation by reducing demand, and therefore growth.
Having looked dumb relying on supply before, it doesn’t want to wait for problems that it can’t control to get fixed. A wise policy. But might the Fed get lucky? The data on supply tells a mixed story.
The trend in energy costs, which seep into all sorts of prices, doesn’t look promising. Forecasts are for a summer cost surge in America, with wholesale energy prices trebling from last summer in some parts of New England. Russia is cutting off gas to Europe just as a big US gas export terminal caught fire, knocking more supply offline for a few months.
For supply chains, it’s less dire, if still not great. The New York Fed’s index of global supply chain pressure gives a good sense of the big picture. It pulls together data on freight costs, backlogs and shipping delays — stripping out demand to find how much inflation pressure is coming from supply constraints. Things are better than late last year, but we’re far from normal:

You see this basic trend — better but still bad — popping up all along the supply chain. Here, for instance, is how much it costs to send a shipping container from China to the US west coast:

Or read what executives at big corporations are saying. In general, larger companies will see better supply-chain conditions first, because they can pay top dollar to secure whatever shipping is available, including more expensive air freight. Some charter their own ships. So we read through several recent earnings calls to get a sense of sentiment. Here, to give one indicative example, is DuPont’s chief executive, Edward Breen, earlier this month:
Yes, so a little better, but it’s tough. Like the teams are working seven days a week and getting containers booked ahead of time. It’s crazy. Going into different ports on the east coast of the US, instead of the west coast — but we’re doing fine. We’re working our way through it. But it’s not normal times, I don’t want to [leave] you with that impression, but it’s just getting a little bit better and mainly because of the Chinese — China, it was so bad, and that’s easing up now.
Less globalised companies than DuPont are saying similar things. The co-chief executive of Lennar, a US homebuilder, called the peak on supply-chain pressures during Tuesday’s earnings call:
There were still intermittent disruptions and an increase in construction costs. But for the first time since the disruptions began, we saw a flattening in cycle time [ie, total time to build a house]. Over the past four months, cycle time has expanded by only five days, which we believe signals [a] peak.
That is good news, but it will take months or years to show up in inflation data. The Fed is not keen to wait. Early signs that inflation expectations are unmooring have thoroughly spooked the central bank. Nice, growth-friendly disinflation from the supply side, it seems, isn’t coming to save us.
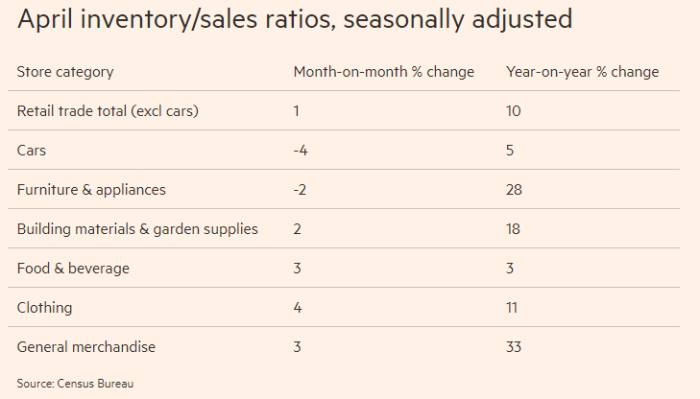
Instead, what we might soon get are supply-side gluts that will lower inflation — but also hurt growth. Recall the bullwhip effect, where companies buy too much during times of scarcity, ending up with excess inventory that later becomes a problem. Last time we wrote about this in May, we noted that inventory-to-sales ratios didn’t look bloated by historical standards. But they have grown exceptionally fast. The latest data, published last week, showed all industries but cars and furniture expanding inventories merrily:
Too much in stock eventually means selling at a discount, as in Target’s huge clearance sale this month. Or it means putting in fewer orders, as in Samsung freezing procurement thanks to bulging inventories. Both are drags on growth.
What is happening in inventories is linked to what has happened in supply chains, explains Eytan Buchman of Freightos, a freight booking platform. He told Unhedged:
One of the most important lessons businesses have learnt over the past couple years is when you can import something, import it. You don’t know whether they’ll be blockages in the port in Shenzhen, or lines of ships waiting to dock in Long Beach. You don’t know what the cost will be.
Such uncertainty incentivised companies to build supply buffers, even in the face of lower projected demand. But now, between swelling stocks and easing demand from monetary tightening and the pivot to services, it’s adding up to a “classic bullwhip period”. Buchman added:
So they’ve been building up an inventory. And suddenly there’s this decline in demand from customers. A very large chunk of our [clients] are attributing it to inflation. So now they have more inventory than they’ve ever had, they’ve paid more to import it than they ever have, but the demand they were expecting to make up for that is suddenly starting to evaporate.
If inflation is your top priority, perhaps these gluts are welcome. But it is another reason to suspect a recession is around the corner. (Ethan Wu)
Some Unhedged loose ends
Readers pointed out a couple of mistakes, or at least failures of transparency, in this week’s letters that we should clarify.
In Tuesday’s discussion of the bond market, Rob compared the yield on the two-year Treasury bond with the yield on the HYG ETF, and quoted the yield on the latter as 5.2 per cent. Readers objected that the yield on HYG is actually over 8 per cent. Well, sort of. The higher number is the yield on the fund’s underlying bond portfolio. It is not the yield on the ETF, which is in fact 5.2 per cent (taking the last monthly distribution and multiplying it by 12). Why the difference? The HYG managers will have bought many of the bonds in the portfolio when rates were lower, and as rates have risen, the prices of those bonds have fallen, increasing the yield on the portfolio (but not the ETF).
Eventually, as the HYG portfolio turns over, its distributions should rise to meet the portfolio yield. But for now, if you want the most liquid available exposure to the high-yield market you will have to live with 5.2 per cent, as against 3 per cent on the shorter duration, credit-risk-free two-year Treasury. We know which we would take, but we are paranoid.
In Wednesday’s letter on the European debt mess, loads of readers thought Rob was a dunce to characterise the mathematics of the situation this way:
Italy’s debt is 150 per cent of gross domestic product. Its 10-year bonds, for example, yield 3.7 per cent. Of course it will have sold debt at lower yields than that, but as old debt rolls over, the cost will rise. GDP, on the other hand, is not going to grow at anywhere near 5.5 per cent (3.7 per cent x 150 per cent). So the Italian debt burden is set to grow steadily bigger relative to GDP.
There are two things left out here that are, as readers insisted, important. The first is inflation and the second is the budget deficit. Inflation increases nominal growth, which is what matters to the debt/GDP ratio. And inflation is high now. The second is that if Italy can run a primary (that is, pre-interest) surplus, then it has more breathing room to service debt — since it doesn’t need to tap capital markets to pay for basic spending.
There is a maths mistake implied in the above: debt can grow at 3 per cent, not of GDP but of itself, and the debt/GDP ratio remains unchanged. That is, at a 150 per cent debt/GDP ratio, with nominal economic growth of (say) 3 per cent, debt can grow by 4.5 per cent of GDP and the ratio remains stable.
My point, however, remains. High inflation will make debt more bearable — but this will of course be a tax on Italians’ real incomes; not an attractive solution. Italy ran a primary deficit of 3.7 per cent next year. And its debt payments are headed up, as a percentage of GDP, unless spreads narrow or it is able to fund itself with cheap short-term debt (which would create another risk). Bring on fiscal union.
One good read
A study shows rightwing Germans tend to be hotter, or maybe hot Germans tend to be rightwing (hat tip to Tyler Cowen for flagging this).
