A look at mortgage rate history
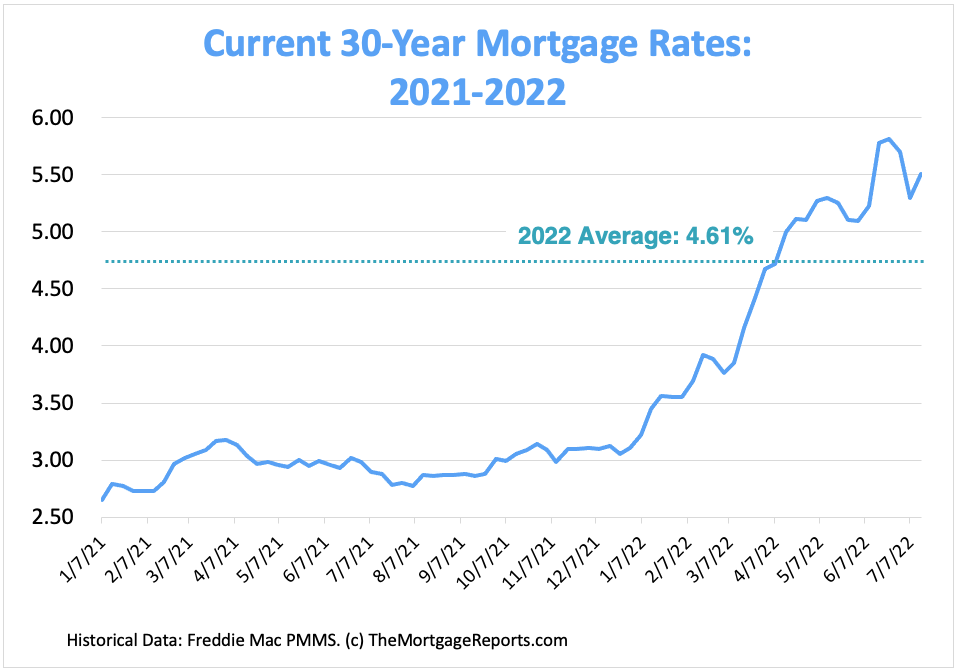
There’s no question that mortgage rates have risen in 2022. Thirty-year rates tipped above 5% in April for the first time in a decade. And between June 9 and June 16 alone, they rose by 55 basis points (0.55%) — the largest one-week increase since 1987.
If there’s a silver lining, it’s that mortgage rates are still relatively low from a historical standpoint. Historically, 30-year fixed rates have averaged just under 8 percent. So even though today’s rates are hovering above 5%, they’re still a good deal comparatively.
Find your lowest mortgage rate. Start here (Jul 16th, 2022)
In this article (Skip to…)
30-year mortgage rates chart: Where are rates now?
Mortgage interest rates fell to record lows in 2020 and 2021 during the Covid pandemic.
Emergency actions by the Federal Reserve helped to push mortgage rates below 3% and keep them there.
But with inflation surging to 41-year highs, mortgage interest rates have risen in 2022. And policy tightening by the Fed is likely to push them higher still.
Those who are in a position to lock an interest rate sooner rather than later may be wise to do so.
Current mortgage interest rates chart
Chart represents weekly averages for a 30-year fixed-rate mortgage. Source: Freddie Mac
Find your lowest mortgage rate. Start here (Jul 16th, 2022)
Historical mortgage rates chart
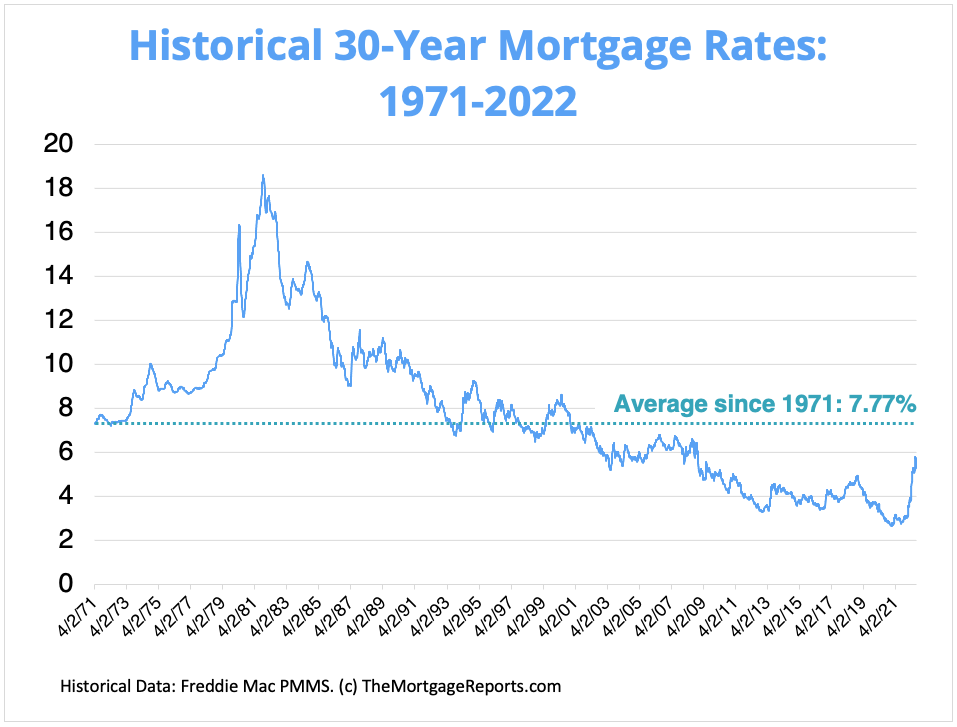
Despite recent rises, today’s 30-year mortgage rates are still below average from a historical perspective.
Freddie Mac — the main industry source for mortgage rates — has been keeping records since 1971.
Between April 1971 and June 2022, 30-year mortgage rates averaged 7.77 percent. So even with the 30-year FRM above 5%, rates are still relatively affordable compared to historical mortgage rates.
Historical 30-year mortgage rates chart
Chart represents weekly averages for a 30-year fixed-rate mortgage. Source: Freddie Mac
Mortgage rate trends over time
For some perspective on today’s mortgage interest rates, here’s how average 30-year rates have changed from year to year over the past five decades.
| Year | Average 30-Year Rate | Year | Average 30-Year Rate | Year | Average 30-Year Rate |
| 1974 | 9.19% | 1990 | 10.13% | 2006 | 6.41% |
| 1975 | 9.05% | 1991 | 9.25% | 2007 | 6.34% |
| 1976 | 8.87% | 1992 | 8.39% | 2008 | 6.03% |
| 1977 | 8.85% | 1993 | 7.31% | 2009 | 5.04% |
| 1978 | 9.64% | 1994 | 8.38% | 2010 | 4.69% |
| 1979 | 11.20% | 1995 | 7.93% | 2011 | 4.45% |
| 1980 | 13.74% | 1996 | 7.81% | 2012 | 3.66% |
| 1981 | 16.63% | 1997 | 7.60% | 2013 | 3.98% |
| 1982 | 16.04% | 1998 | 6.94% | 2014 | 4.17% |
| 1983 | 13.24% | 1999 | 7.44% | 2015 | 3.85% |
| 1984 | 13.88% | 2000 | 8.05% | 2016 | 3.65% |
| 1985 | 12.43% | 2001 | 6.97% | 2017 | 3.99% |
| 1986 | 10.19% | 2002 | 6.54% | 2018 | 4.54% |
| 1987 | 10.21% | 2003 | 5.83% | 2019 | 3.94% |
| 1988 | 10.34% | 2004 | 5.84% | 2020 | 3.10% |
| 1989 | 10.32% | 2005 | 5.87% | 2021 | 2.96% |
Source: Freddie Mac
Can 30-year mortgage rates go lower?
The short answer is that mortgage rates could always go lower. But you shouldn’t expect them to.
With inflation at 40-year highs and the Federal Reserve making aggressive rate hikes to combat it, mortgage rates seem likely to rise in the near future. Remember that the Fed does not set mortgage rates, but these rates often follow the same general trend as the overall market.
That said, rates have been more volatile lately due to recession fears and we’ve seen some drops in recent weeks.
As always, rates move unpredictably and it’s tough to time the market — especially with so many unknowns about where the economy is currently headed. Home buyers are typically better off buying when they’re financially ready regardless of the rate market.
Remember that you’re not stuck with a mortgage rate forever. If rates drop significantly, homeowners can always refinance later on to cut costs.
Mortgage rate predictions for 2022
At the time of this writing (July 2022), inflation in the U.S. was at a four-decade high. And the Federal Reserve was enacting aggressive rate hikes to try to tame it. These and other red flags had many buyers worried about the possibility of a recession and what it would mean for the housing market.
While the Fed’s actions are currently nudging mortgage rates higher, the opposite could also be true. If the Federal Reserve manages to get inflation under control, mortgage rate growth may eventually cool off as well.
But there are a lot of unknowns. And even if rates do cool off, borrowers should not expect them to drop back into the record low, 2-3% territory seen over the past two years. Those historic mortgage rates were due to exceptional circumstances — namely, the coronavirus pandemic — and only a massive, unexpected economic downturn could bring rates back to such lows.
Find your lowest mortgage rate before they rise further. Start here (Jul 16th, 2022)
Historic mortgage rates: Important years for rates
The long–term average for mortgage rates is just under 8 percent. That’s according to Freddie Mac records going back to 1971.
But mortgage rates can move a lot from year to year — even from day to day. And some years have seen much bigger moves than others.
Let’s look at a few examples to show how rates often buck conventional wisdom and move in unexpected ways.
1981: The all-time high for mortgage rates
1981 was the worst year for mortgage interest rates on record.
How bad is bad? The average mortgage rate in 1981 was 16.63%.
- At 16.63% a $200,000 mortgage has a monthly cost for principal and interest of $2,800
- Compared with the long-time average that’s an extra monthly cost of $1,300 or $15,900 per year
And that’s just the average — some people paid more.
For the week of Oct. 9, 1981, mortgage rates averaged 18.63%, the highest weekly rate on record, and almost five times the 2019 annual rate.
2008: The mortgage slump
2008 was the final gasp of the mortgage meltdown.
Real estate financing was available in 2008 for 6.03% according to Freddie Mac.
- The monthly cost for a $200,000 mortgage was about $1,200 per month, not including taxes and insurance
Post 2008, rates declined steadily.
2016: An all-time low for rates
Until recently, 2016 held the lowest annual mortgage rate on record going back to 1971. Freddie Mac says the typical 2016 mortgage was priced at just 3.65%.
- A $200,000 mortgage at 3.65% has a monthly cost for principal and interest of $915
- That’s $553 a month less than the long-term average
Mortgage rates had dropped lower in 2012, when one week in November averaged 3.31%. But some of 2012 was higher, and the entire year averaged out at 3.66% for a 30-year mortgage.
2019: The surprise mortgage rate drop-off
In 2018, many economists predicted that 2019 mortgage rates would top 5.5%. That turned out to be wrong.
In fact, rates dropped in 2019. The average mortgage rate went from 4.54% in 2018 to 3.94% in 2019.
- At 3.94% the monthly cost for a $200,000 home loan was $948
- That’s a savings of $520 a month — or $6,240 a year — when compared with the 8% long–term average
In 2019, it was thought mortgage rates couldn’t go much lower. But 2020 and 2021 proved that thinking wrong again.
2021: The lowest 30-year mortgage rates ever
Rates plummeted in 2020 and 2021 in response to the Coronavirus pandemic.
By July 2020, the 30-year fixed rate fell below 3% for the first time. And it kept falling to a new record low of just 2.65% in January 2021.
- At 2.65% the monthly cost for a $200,000 home loan is $806 a month not counting taxes and insurance
- You’d save $662 a month, or $7,900 a year, compared to the 8% long-term average
However, record-low rates were largely dependent on accommodating, Covid-era policies from the Federal Reserve. Those measures were never meant to last. And the more U.S. and world economies recover from their Covid slump, the higher interest rates are likely to go.
2022: Mortgage rates spike
Thanks to sharp inflation growth, higher benchmark rates, and a drawback on mortgage stimulus by the Fed, mortgage rates spiked in the first six months of 2022.
According to Freddie Mac’s records, the average 30-year rate jumped from 3.76% to 5.78% between March 3 and June 16 — an increase of over 200 basis points (2.00%) in just three months.
Rates could continue to increase throughout the year. Where they’ll plateau, it’s impossible to say.
Factors that affect your mortgage interest rate
For the average homebuyer, tracking mortgage rates helps reveal trends. But not every borrower will benefit equally from today’s low mortgage rates.
Home loans are personalized to the borrower. Your credit score, down payment, loan type, loan term, and loan amount will affect your mortgage or refinance rate.
It’s also possible to negotiate mortgage rates. Discount points can provide a lower interest rate in exchange for paying cash upfront.
Let’s look at some of these factors individually:
Credit score
A credit score above 720 will open more doors for low-interest-rate loans, though some loan programs such as USDA, FHA, and VA loans can be available to sub-600 borrowers.
If possible, give yourself a few months or even a year to improve your credit score before borrowing. You could save thousands of dollars through the life of the loan.
Down payment
Higher down payments can shave your borrowing rate.
Most mortgages, including FHA loans, require at least 3% or 3.5% down. And VA loans and USDA loans are available with 0% down payment.
But if you can put 10%, 15%, or even 20% down, you might qualify for a conventional loan with low or no private mortgage insurance and seriously reduce your housing costs.
Loan type
The type of mortgage loan you use will affect your interest rate. However, your loan type hinges on your credit score. So these two factors are very intertwined.
For example, with a credit score of 580 you may qualify only for a government-backed loan such as an FHA mortgage. FHA loans have low interest rates, but come with mortgage insurance no matter how much money you put down.
A credit score of 620 or higher might qualify you for a conventional loan, and — depending on your down payment and other factors — potentially a lower rate.
Adjustable-rate mortgages traditionally offer lower introductory interest rates compared to a 30-year fixed-rate mortgage. However, those rates are subject to change after the initial fixed-rate period.
So an initially lower ARM rate could rise substantially after 5, 7, or 10 years.
Loan term
In this post we’ve tracked rates for 30-year fixed-rate mortgages, but 15-year fixed-rate mortgages tend to have even lower borrowing rates.
With a 15-year mortgage, you’d have a higher monthly payment because of the shorter loan term. But throughout the life of the loan you’d save a lot in interest charges.
At a 3% interest rate for a $200,000 home loan, you’d pay $103,000 in interest charges with a 30-year mortgage paid off on schedule. A 15-year fixed-rate mortgage would cost only about $49,000 in interest.
Loan amount
Rates on unusually small mortgages — a $50,000 home loan, for example — tend to be higher than average rates because these loans are less profitable to the lender.
Rates on a jumbo mortgage loan tend to be higher, too, because lenders have a higher risk of loss. Jumbo loans help shoppers buy high-value real estate.
Discount points
A discount point can lower interest rates by about 0.25% in exchange for upfront cash. A discount point costs 1% of the home loan amount.
For a $200,000 loan, a discount point would cost $2,000 upfront. However, the borrower would recoup the upfront cost over time thanks to the savings earned by a lower interest rate.
Since interest payments play out over time, a buyer who plans to sell the home or refinance within a couple of years should probably skip the discount points and pay a higher interest rate for a while.
Some rate quotes assume the home buyer will buy discount points, so be sure to check before closing on the loan.
Other mortgage costs to keep in mind
Remember that your mortgage rate is not the only number that affects your mortgage payment.
When you’re estimating your home buying budget, you also need to account for:
- Down payment
- Closing costs
- Discount points (optional)
- Private mortgage insurance (PMI) or FHA mortgage insurance premiums
- Homeowners insurance
- Property taxes
- HOA dues (if buying in a homeowners association)
Luckily, when you get pre-approved, you’ll receive a document called a Loan Estimate that lists all these numbers clearly for comparison.
Use your Loan Estimates to find the best overall deal on your mortgage — not just the best interest rate.
You can also use a mortgage calculator with taxes, insurance, and HOA dues included to estimate your total mortgage payment and home buying budget.
When to lock your mortgage rate
Keep an eye on daily rate changes. But if you get a good mortgage rate quote today, don’t hesitate to lock it in.
Remember, if you can secure a 30-year mortgage rate at or below 6%, you’re paying less than most American homebuyers throughout history. That’s not a bad deal.


