

Which is the best date for SIP in mutual funds?
I get this question often from my investors.
My two usual reactions are:
- What is your lucky date?
- Toss a coin.
It doesn’t matter.
Last week, an investor asked me, “Have you done any analysis for this?”
I hadn’t.
I thought of giving this a shot.
Data and Assumptions
- I have used Nifty TRI data from January 1, 2000, until October 31, 2020. That’s data of over 20 years. A total of 250 months.
- Start a SIP of Rs 10,000 per month on each of the dates (1st to 31st) in January 2000. A total of 31 SIPs.
- If the SIP date falls on a weekend or market holiday, the SIP installment gets invested on the next business day. Hence, it is possible that not all installments of a SIP get invested on the same date. You may have started a SIP on15th of each month but if the 15th is a market holiday, your money gets invested on 16th or the next business day.
- Not all months have 31 days. February has only 28 days (29 days in a leap year). Hence, if the date (29, 30, 31) does not fall in a particular month, the SIP installment gets invested on the next business (1st of next month or after).
What does the data tell us?

In the above table, I have shown, for each of the SIP dates, the deviation from the average accumulated amount. Average Accumulated Amount is the simple average of the accumulated amounts for 31 SIP dates. And the deviation is for the difference in absolute amounts and not XIRR.
The difference is not much. Over 20 years, the difference between the minimum and the maximum is about 1.3%. I do not understand statistics much but I wouldn’t bother to optimize for such a small difference.
Over these 20 years, 9th has been the worst SIP date and 23rd has been the best.
Let’s now divide this period into two parts.
- January 1, 2000 until December 31, 2010 (132 months)
- January 1, 2011 until October 31, 2020 (118 months)
And do a similar analysis for these two periods.
January 1, 2000 until December 31, 2010
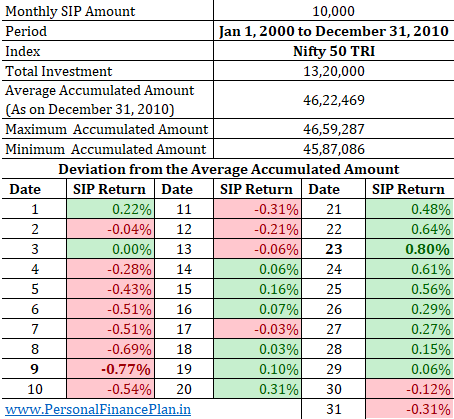
The difference between the best (23rd) and the worst (9th) is about 1.5%.
January 1, 2011 until October 31, 2020
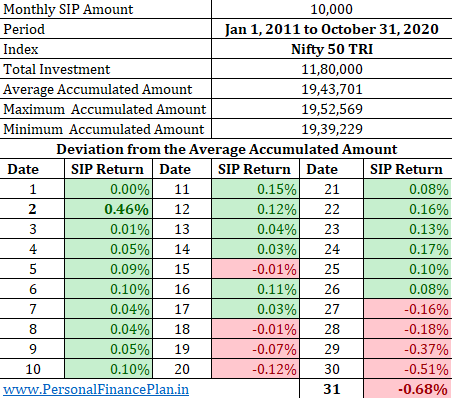
The difference between the best (2nd) and the worst (31st) is about 1.1%. Again not much.
The difference between 9th and 23rd is (the difference was the widest between these two dates in the previous two comparisons) is about 0.1%. Essentially, the bulk of the difference comes from the period 2000-2010.
The Caveats
- I have used Nifty 50 TRI for this analysis. Other indices (midcap or the small cap index) might show a pattern (though I expect results to be similar).
- You may be investing in an actively managed fund. It might show a different pattern. Again, I expect results to be similar.
I think you have better and more important things to focus in your portfolio than figuring out the best SIP date for investment in mutual funds. To me, it seems an exercise in futility. Your time and effort is better spent on sticking to the right asset allocation, regular portfolio rebalancing and doing things that you enjoy.
As I said earlier, what’s your lucky date?
Data Source: NiftyIndices.com
Additional Links
Over the past few months, we have tested various investment strategies or ideas and compared the performance against the Buy-and-Hold Nifty 50 portfolio. In some of the previous posts, we have:
- Assessed whether adding an International Equity Fund and Gold to an Equity portfolio has improved returns and reduced volatility.
- Does Momentum Investing work in India?
- Does Low Volatility investing beat Nifty and Sensex?
- Performance Comparison: Investing on 52-week Lows vs Investing on 52-week Highs
- Nifty 200 Momentum 30 Index: Performance Review
- Nifty Factor Indices (Value, Momentum, Quality, Low Volatility, Alpha): Performance Comparison
- Nifty Alpha Low Volatility 30: Performance Review
- 50% Gold + 50% Equity: How does the portfolio perform?
- What is the Best Asset Allocation for your portfolio? 50:50, 60:40 or 70:30?
- Considered the data for the past 20 years to see if the Price-Earnings (PE) multiple tells us anything about the prospective returns. It does, or at least has in the past.
- Tested a momentum strategy to shift between Nifty 50 and a liquid fund and compared the performance against a simple 50:50 annual rebalanced portfolio of Nifty index fund and liquid fund.
- Used a Simple Moving Average Based Market Entry and Exit Strategy and compared the performance against Buy-and-Hold Nifty 50 over the last two decades.
- Compared the performance of Nifty Next 50 against Nifty 50 over the last two decades.
- Compared the performance of Nifty 50 Equal Weight vs Nifty 50 vs Nifty 50 over the last 20 years.
- Nothing works all the time. Used Nifty 50, Nifty MidCap 150, and Nifty Small Cap 250 index to demonstrate that sometimes intuitive investment choices do not work.
- Compared the performance of 2 popular balanced funds against a simple combination of an index fund and a liquid fund.
- Compared the performance of a popular dynamic asset allocation fund (Balanced advantage fund) against an equity index fund and see if it has been able to provide reasonable returns at low volatility.
Image Credit: Unsplash
The post was first published in November 2020.
