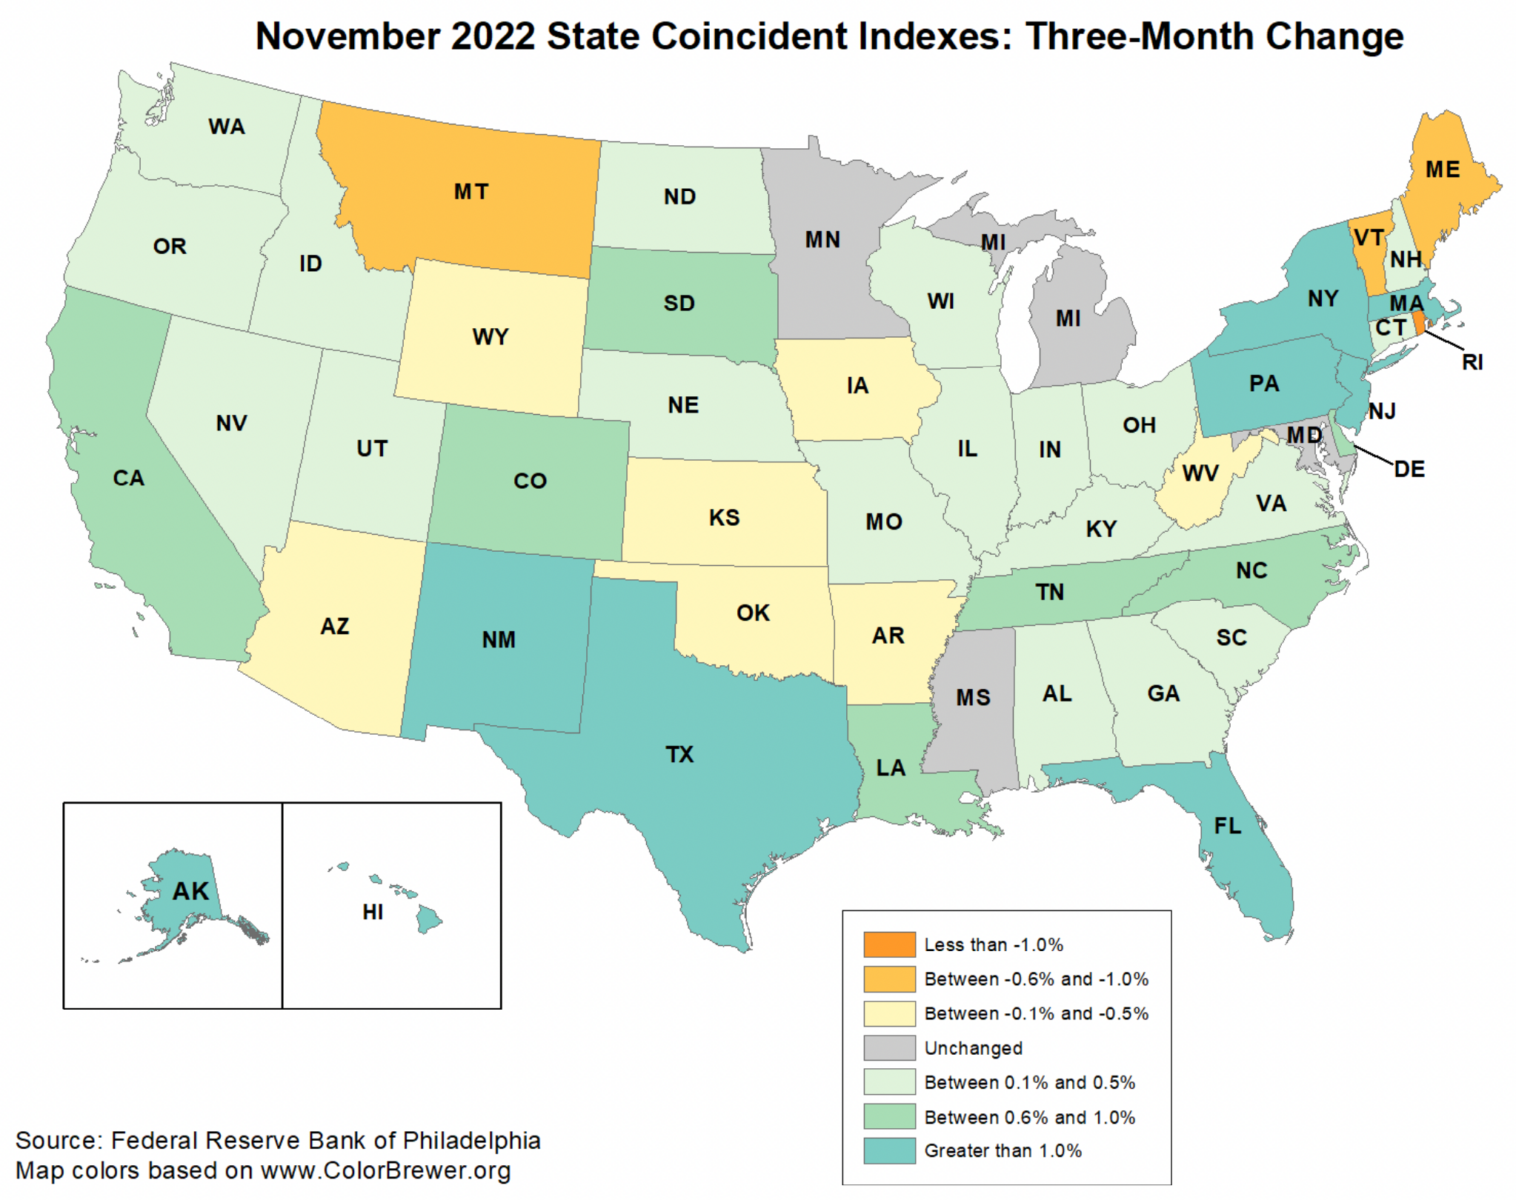
The Philly Fed’s November State Coincident Indicators snuck out while I was away (1/28/22). There are increasing signs of local distress revealed in the midwest, and lots of softness elsewhere
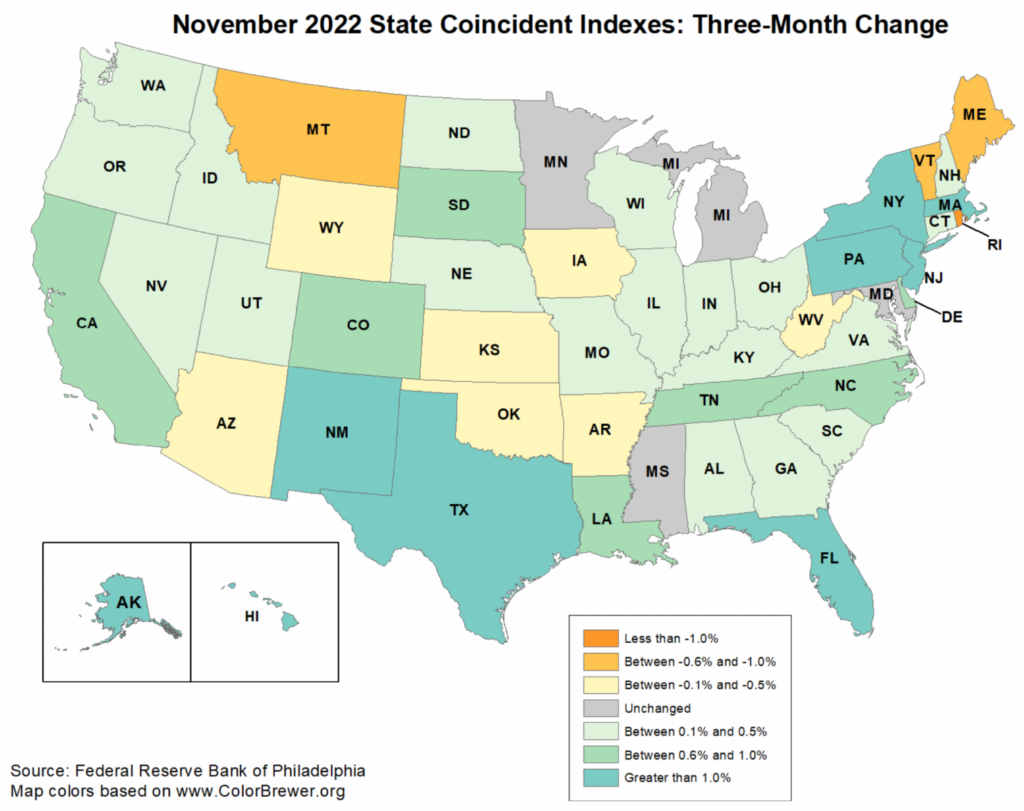
As detailed here, over the past month, the SCI indicies increased in 30 states, decreased in 13 states, and remained stable in seven, for a one-month diffusion index of 34. That is an improvement over October, when the indexes increased in 20 states, decreased in 22 states, and were stable in 8.
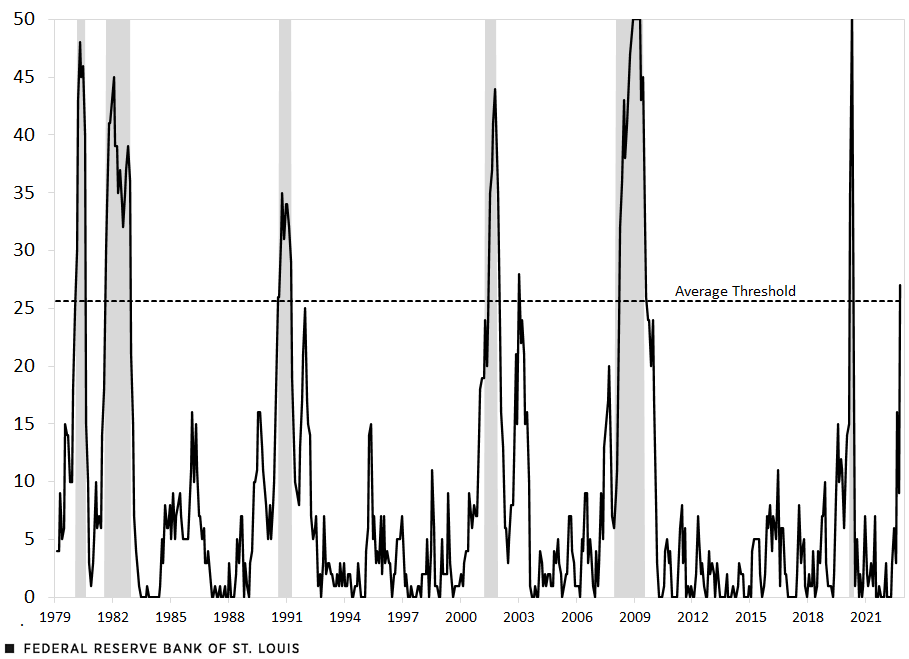
The Philly Fed map is based on Bureau of Labor Statistics (BLS) employment data for the states; the St Louis Fed builds on that, creating an ongoing chart that shows the relationship between the state data and recessions:
Number of States with Negative Growth (State Coincident Indexes)
I have one minor quibble about this chart above based on the data (at top) via the St Louis Fed: It is not that 26 states have “Negative growth,” but that many of these states have “growth rates that are falling (some are positive, some negative).” Not to be too picayune but there is a difference between the two.
I think of “Negative Growth” as below zero or contractionary, whereas “Falling Growth” is simply below where it was the month prior (positive or negative).
I reached out to its author to clarify the data.
UPDATE: Jan 4 2022 10:53am
Kevin Kliesen responds:
“This is one of those instances when data revisions complicate the life of a forecaster!
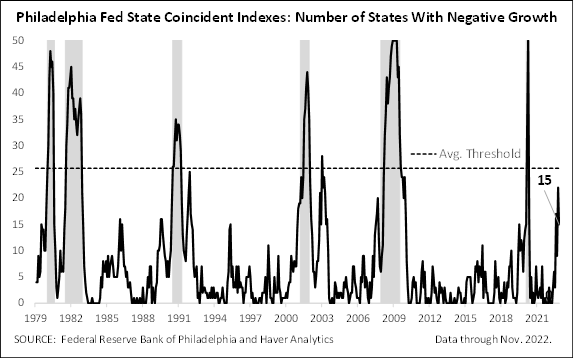
My co-author updated the chart and the November data now show that the number of states with negative growth is well below the threshold—at 15. I knew about the issue of revision with the underlying CES data, and in hindsight I should have stressed it. But I didn’t. That’s my mistake. The bottom line is that while there seems to be an historically reliable signal from looking at the data this way, the recent observations—as with the national data—can revise significantly.”
Here is the updated chart:
Sources:
State Coincident Indexes November 2022 (PDF)
The Federal Reserve Bank of Philadelphia, December 28, 2022
Are State Economic Conditions a Harbinger of a National Recession?
By Kevin L. Kliesen , Cassandra Marks
St Louis Fed, December 28, 2022


