Inflation continues to be a hot-button topic. We (and many others) have written about TIPS, TIPS funds, and Series I Bonds. This article is not about adding or altering recommendations. Instead, we let the data do the talking. Instead of prescribing an investment thesis, I want to see how market participants are behaving by watching their actions. Some light commentary will try to connect the images and tables into a narrative. You could be forgiven if you detect an underlying theme that sounds like “a rational flight from irrational complexity”!
1. The Consumer Price Index – Urban Reference Index
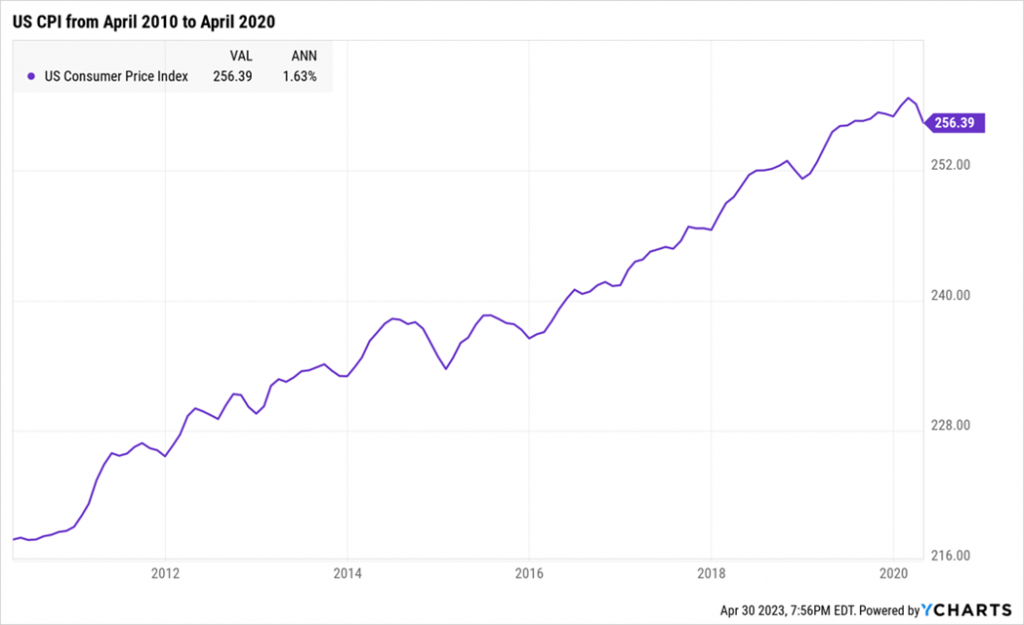
Inflation from April 2010 to April 2020 annualized at 1.63% a year:
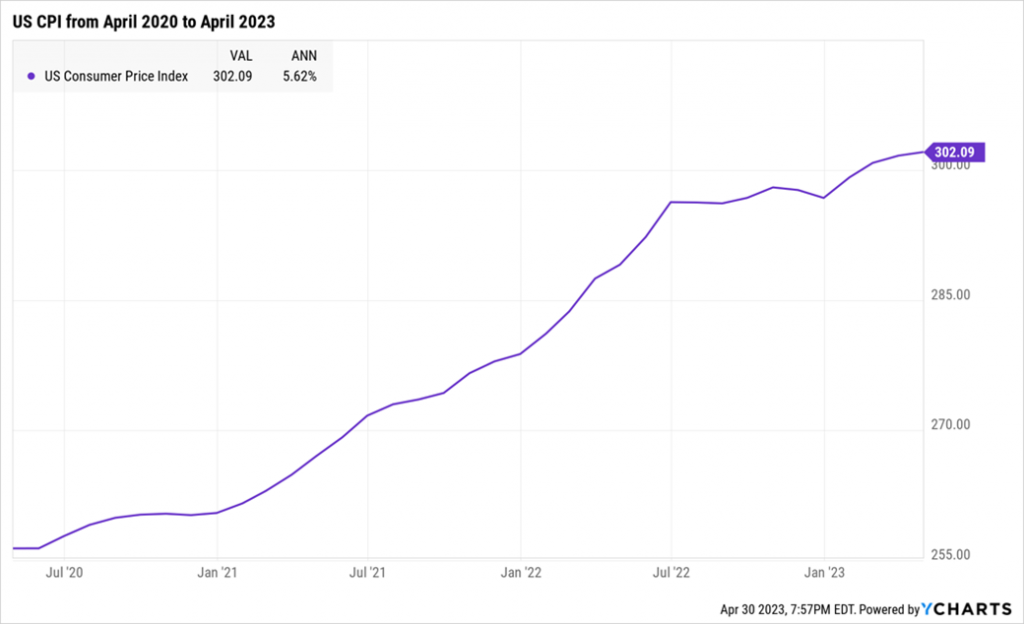
But from April 2020 to April 2023, the rate of inflation soared to 5.62% a year:
Annual Accumulated CPI Rate
| Calendar Year | Annual Accumulated Inflation Rate |
| 2010 | 1.50% |
| 2011 | 2.96% |
| 2012 | 1.74% |
| 2013 | 1.50% |
| 2014 | 0.76% |
| 2015 | 0.73% |
| 2016 | 2.07% |
| 2017 | 2.11% |
| 2018 | 1.91% |
| 2019 | 2.29% |
| 2020 | 1.36% |
| 2021 | 7.04% |
| 2022 | 6.45% |
| 2023 to April | 1.70% |
(Data from Y-Charts)
Projected inflation for the whole of 2023 is between 3.5% and 4.5% at this point.
2. Federal Reserve Bank Decisions on Rates (and indirectly Treasury Bills)
In reaction to this sharp increase in inflation, the Federal Reserve has increased its overnight target interest rate:
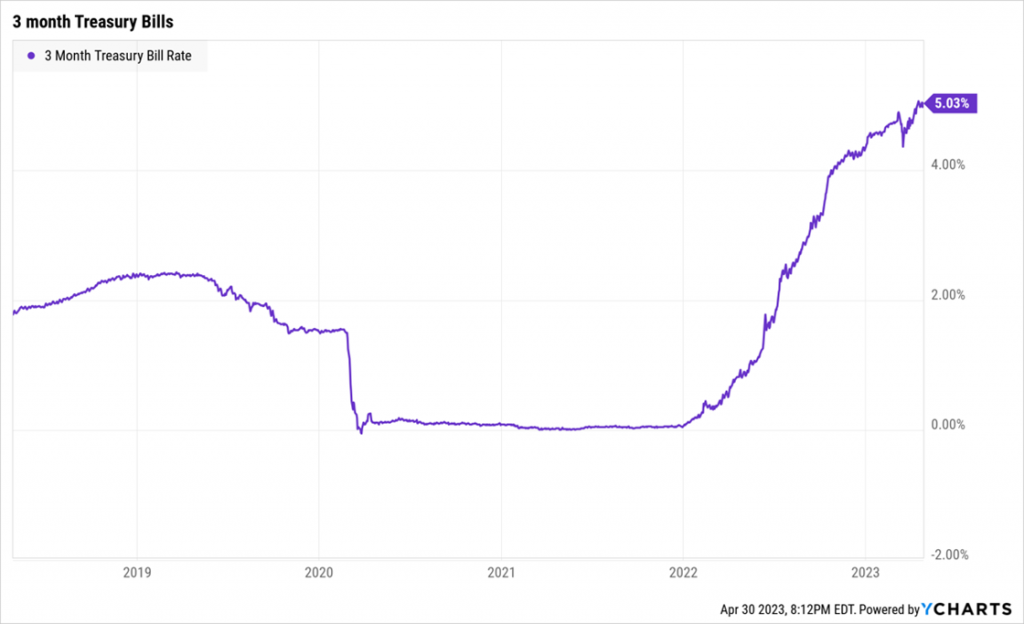
Increase in Fed Funds Rate led to a predictable increase in short-term Treasury Bills:
3. Money Market Funds.
Many money market funds hold short-term US Government Treasury Bills, bills like the ones above that yield over 5% per annum. Market participants are sharp. People withdrew deposits from banks and invested in money market funds. MFO Premium has 29 funds in the Money Market category with a category AUM of $638 Billion. Here is a subsection of those funds and the data from Y-Charts.
The funds here have an AUM of $616.9 billion. Note that YTD, these funds have had a net inflow of $49.8 Billion, and over the last year, the net fund inflows have been $324 billion. More than half of all assets in money market funds have been added in the last 1 year!
Besides these funds, we know that investors have bought T-Bills and CDs directly as well. Those numbers are not captured in the exhibit above. What emerges is one technique people are using to deal with high inflation:
Federal Reserve raised interest rates to fight inflation >> Short-term Treasury Bills offering higher yield >> Investors moving money into Money Market Funds, CDs, and T-Bills.
4. Series I Bonds
We have talked about Series I Bonds when discussing inflation strategies:
Thoughts on Inflation Protection (Feb 2022), I wish I could give you some TIPS on beating inflation (August 2022), Series I Bonds: A Ray of Hope (October 2022), and Long-dated TIPS Bonds: A Margin of Safety (Jan 2023)
I made a YouTube video from a few years ago: US Government Savings Bonds An Exceptional Deal for the Small Saver Video 39 at https://youtu.be/fW9nfh0JE2Y
Briefly speaking, Series I Bonds are US Government Savings Bonds. They can be bought only by US taxpayers up to the limit of $10,000 each calendar year. (NB: Tax refunds can be applied for an additional $5000.)
Series I Bonds are neat because the principal can never go down (even in deflation), there is no price fluctuation (the bonds do not trade in the secondary market), and the bonds are not subject to changes in real rates (unlike TIPS they neither benefit nor lose from changes in real rates). In other words, Series I Bonds are simple ways to benefit from high inflation.
If you can tell an American a simple story, and if rings true, they will act with force.

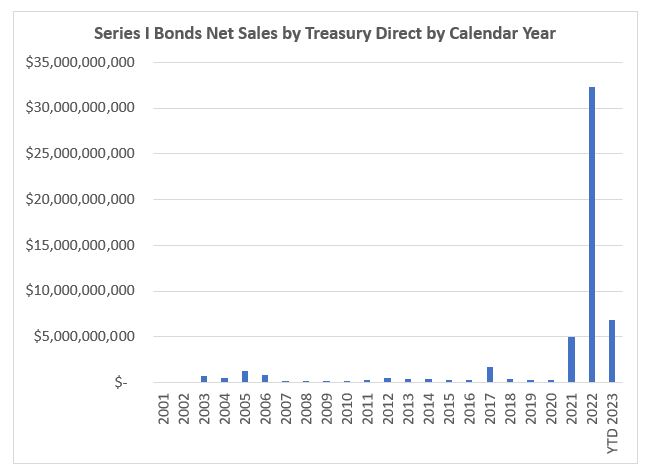
Starting at some point in 2021, investors discovered Series I Bonds. From investing only $345 million in 2020, investors bought $5 billion in 2021, $32.3 billion in 2022, and for the first four months of 2023, $6.8 billion in these bonds. Why? The yields were high.

Juicy coupons from the US Government: On an annual basis, the composite yield on Series I Bonds went from a boring 1-2% zone in 2019 and 2020, to as much as 9.62% in 2022, before declining to 6.48% and most recently to 3.38%
New buyers, as of May 2023, also receive an additional 0.9% real rate in addition to the 3.38% yield for the next 6 months, for a composite rate of 4.28%.
The name is Bond, I Bond.

Treasury Direct data
As we can see from the chart above, American savers know a good deal when it’s on offer. In the last 12 months, Americans have net bought $30.3 Billion in bonds. Hold on to those numbers, as we will find it interesting in the context of TIPS funds net flows in the same period.
5. TIPS Mutual Funds
In the category of Inflation-Protected Bonds, MFO Premium reports 85 separate funds, with a combined category AUM of $256 Billion. Some of these funds carry international bonds and floating-rate bonds, and some others use options and hedges. I’ve tried to tidy the data to keep it mostly TIPS funds.
Here is my YouTube Video link that explains TIPS:
US Government Inflation Linked Bonds An Overview Video 37 @ https://youtu.be/dOyHoiNChjw and US Government TIPS Technical Details: Video 38 @ https://youtu.be/V5bYdfe0syU
I’ve learnt through the last year that TIPS are anything but easy to understand for all but the most sophisticated bond investors. I cannot change that right now. Anyways, this article is not about a recommendation. It’s about observing what the market is doing. Data that follows is from Y-Charts.
So, what is the market doing?
I’ve sorted the TIPS universe into three categories:
Short Dated TIPS (Less than five years to maturity), Intermediate TIPS (Between 0 and 10 years to maturity), and Long Dated TIPS (5 to 30 years in maturity)
Let’s take each category on its own:
Short Dated TIPS (Less than 5 years to maturity)

Short-dated TIPS funds have an AUM of about $93 Billion. The median fund is up 2.5% in 2023, with total returns being as low as 2.1% and as high as 3.3% for the year. In 2022, the median fund was down 4.3%, and in 2021, the median fund was up 5.4% for the year.
2022’s negative return was a massive put-off for investors. Thus, YTD in 2023, short-dated funds have lost $1.2 Billion in assets, and over the last year, the funds have lost $4.4 Billion in AUM.
Look at the various Yields associated with these funds according to MFO Premium’s Lipper Data:
Which number to look at and why? Oh, it can be so confusing! Who cares. Just sell, investors said. Too complicated to bother to understand. The investor votes with her feet, explaining the one-year outflows of $4.4 billion. Series I Bonds are simpler to understand and invest in.
Intermediate TIPS (Between 0 and 10 years to Maturity)
TIPS Funds that have bonds between 0 and 10 years to Maturity have an AUM of about $137 Billion.
The median fund has a total return of +3.6% in 2023. In 2022, the median return for this maturity category was -11.95%, and in 2021, it was up +5.6% for the year. Once again, investors voted with their feet. YTD, they have pulled $4.5 billion from these funds, and over the last year, these funds have lost $23 billion in assets. That’s a substantial percentage of the existing AUM in intermediate TIPS funds.
Even though, with great patience, one can explain to the investor why the cumulative return for these funds between 2021 and 2023 is negative (it’s all about real yields), investors don’t care. A dollar short and a year late.
Long Dated TIPS (5 to 30 years in Maturity)
Long-dated TIPS Funds hold about $10.9 billion in AUM.
The median fund has gained about 5.3% total return in 2023 so far, after a disastrous 2022 where the median fund lost 32% for the year!
Interestingly, both YTD and one-year fund flows have been positive, adding $239 million and $2.9 Billion, respectively.
What explains this move on the part of investors? Maybe, a very small fraction of investors have reached into the longest-dated TIPS bonds as a value or duration play?
Time will tell. My articles and my own portfolio as I have written point to some hope here.
The trouble with some of these longer-dated TIPS and TIPS funds is their high volatility and illiquidity. Many investors, and rightly so, are not comfortable with the idea of their “safe” fixed-income bucket being a volatile addition to their portfolio. Until this volatility persists in long-duration bonds, flows will not come in.
6. Conclusion: TIPS Funds + Series I Bonds Net Flows + Money Market Funds
If our numbers are roughly correct, it looks like we have $240 billion in AUM in various TIPS funds and $53 billion in Series I Bonds. That’s a total investment of about $294 billion in Inflation products excluding direct investments into TIPS.
YTD, investors have sold $5.8 billion in short and intermediate TIPS. Meanwhile, they have bought $239 million in long-dated TIPS and $6.8 Billion in Series I Bonds.
Over the last year, investors have sold $27.8 Billion in short and intermediate TIPS funds to buy $30.3 Billion in Series I Bonds and $2.9 Billion in long-dated TIPS funds.
From these numbers, it seems investors have sold duration in Inflation Products. Selling short and intermediate TIPS funds and buying Series I bonds is reducing duration. Changes in Long-dated TIPS are minimal.
We can say that investors have generally traded out of complexity and into simplicity. Out of difficult-to-understand TIPS funds and into simple US Government saving bonds. Out of difficult-to-understand inflation-linked dividend payments from TIPS funds and into the fully understandable Series I Bonds.
Investors have surprisingly traded out of a product they can buy and sell any day (ETFs and mutual funds) and into a product that requires reasonably long-term holding (Series I Bonds). That is a surprising move by investors who are often chided for their trigger-happy behavior in day trading. Good.
Let us also recall that investors added $324 billion in the last year to money market funds.
All in all, the “market,” as I have narrowly defined by funds and Series I Bonds, prefers to live in very short-dated bonds (nominal and inflation-protected) with almost zero duration. Of course, there are other products, and this article is fairly confined in its analysis to a small set of products.
7. Message for fund developers and investors
Investors like to buy things they can understand that are simple and predictable. There is virtue in keeping it simple. Sometimes, and in some places, life is complex. If you are a lucky investor with significant assets, Series I Bonds will not do because of their $10,000 per year investment cap. One will need to learn the complexities of Real Yields and Duration to invest in TIPS and TIPS funds.
For a fund developer, the message is to stick to the message. Somehow, investors expect yield from fixed income. If we have told investors that TIPS will accrue based on (lagged) CPI, then maybe the funds should pay monthly income based on that CPI. Even though that would be unnatural for TIPS – because the principal accrues, the interest does not walk in – better to pay a floating coupon by selling some TIPS to fund the interest. Investors might be willing to ignore the volatility of the TIPS if they can be certain they will get the realized inflation as expected every month. It’s counterintuitive, but predictability is more important in the case of fixed-income investors.
[NB: I welcome perspectives from readers about how to read the market flows in a different way or if we have some of the numbers or assumptions incorrect. Drop me a note!]


