
Jerome Powell and the Federal Reserve spend a lot of time worrying about Inflation Expectations.
They shouldn’t.
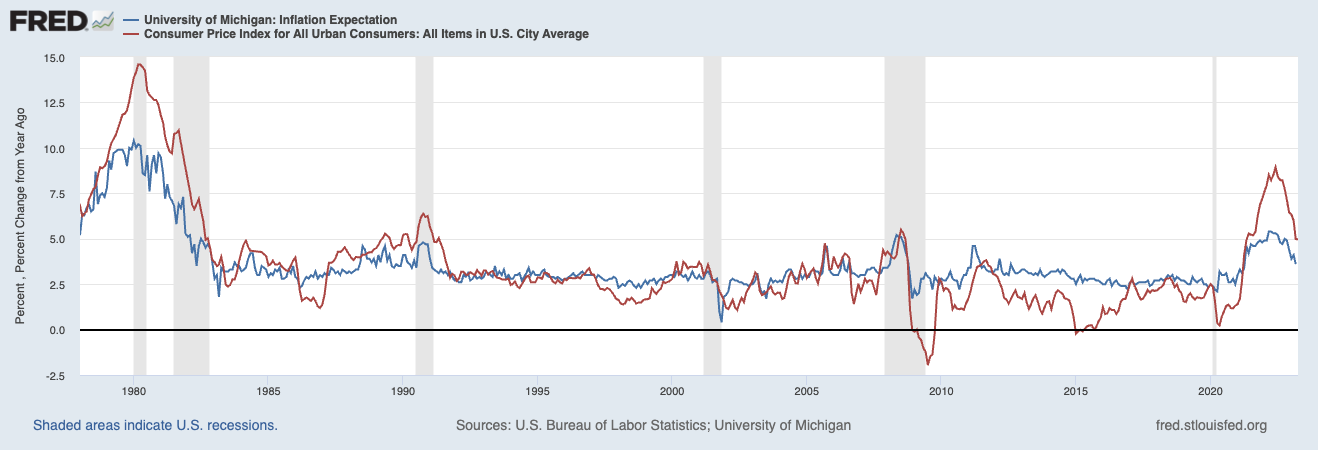
Sentiment surveys in general are mostly useless (except at the extremes). They aren’t merely lagging, backward-looking indicators, but instead, tell you what the public experienced 3- 6 months ago. Beyond short-term extrapolation, they have little to no ability to provide insight into intermediate-term (6-12 months) inflation. As to longer-term, 5-year inflation expectations, they are ridonkulously, hilariously wrong.
Here is Brookings explaining inflation expectations origins:
“Central bankers’ focus on inflation expectations reflects the emphasis that academic economists, beginning in the late 1960s (including Nobel laureates Edmund Phelps and Milton Friedman), put on inflation expectations as key to the relationship that ties inflation to unemployment.”
So, the pre-globalization, pre-automation, and pre-behavioral finance analog era of the 1970s is the driver of this indicator. This explains in part why it is mostly useless. And yet, despite that, people with important jobs still give it weight. As the nearby charts make clear, they shouldn’t.
We have discussed the problems of forecasting enough in the past that I won’t spend too much time here, other than to point out that humans as a species have no idea what is going to happen in a month or 3, much less 5 years hence.
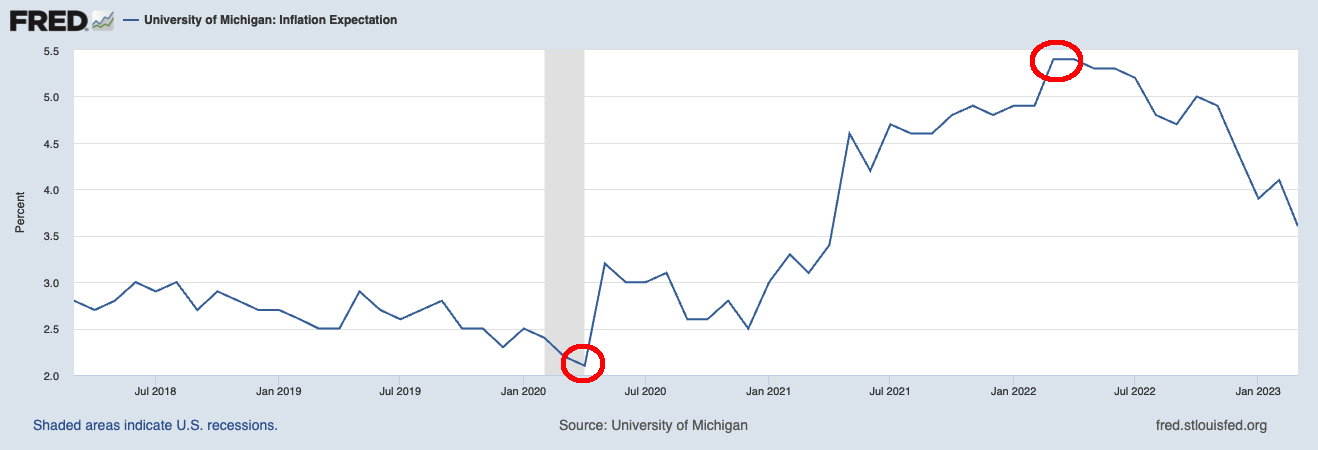
More specifically, as a group, people get things like inflation expectations precisely backward: Their expectations of inflation are at the very LOWEST right before a spike in inflation is about to occur. As if that wasn’t bad enough, their expectations of inflation are at the very HIGHEST right before inflation peaks and rolls over.
The FRED chart at top shows the high and low of the University of Michigan Inflation Expectations Survey during the pre- and post-pandemic era (2018-2023).
To make this clearer, let’s overlay year-over-year CPI changes1 on Inflation Expectations:
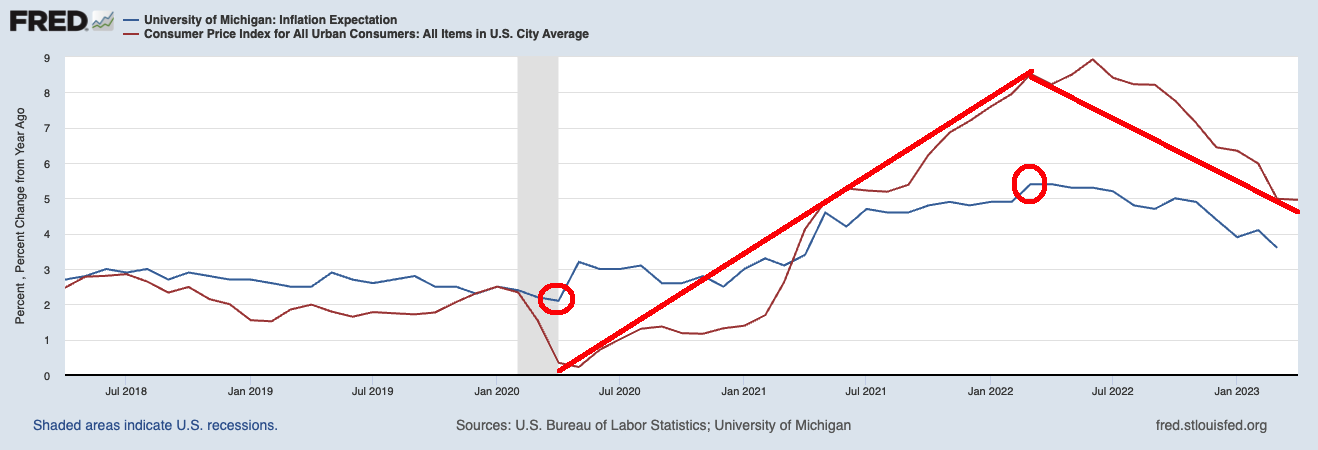
As you can see, expectations bottomed in early 2020, just as CPI began its epic run-up into double digits about a year later. And as Inflation Expectations plateaued at the peak of inflation, guess what happened to CPI over the ensuing months?
Annualized inflation:
July 8.52%
Aug 8.26%
Sept 8.20%
Oct 7.75%
Nov 7.11%
Dec 6.45%
Jan 6.41%
Feb 6.04%
March 4.98%
April 4.93%.
As you would expect,2 expectations peaked, just before it began an epic collapse, especially in goods inflation.
Anyone who wants to use Inflation Expectations as an indicator is welcome to — just so long as you recognize that they are a CONTRARY INDICATOR…
Previously:
2000: “No matter how you cut it, you’ve got to own Cisco” (May 15, 2023)
Can Anyone Catch Nokia? (October 26, 2022)
Gradually, Then Suddenly (October 1, 2021).
Why the Apple Store Will Fail (May 20, 2021)
Nobody Knows Nuthin’ (May 5, 2016)
How News Looks When Its Old (October 29, 2021)
__________
1. Because the CPI swing is so large, it compresses expectations) makes the expectations portion appear compressed
2. That list is via my colleague Ben Carlson

