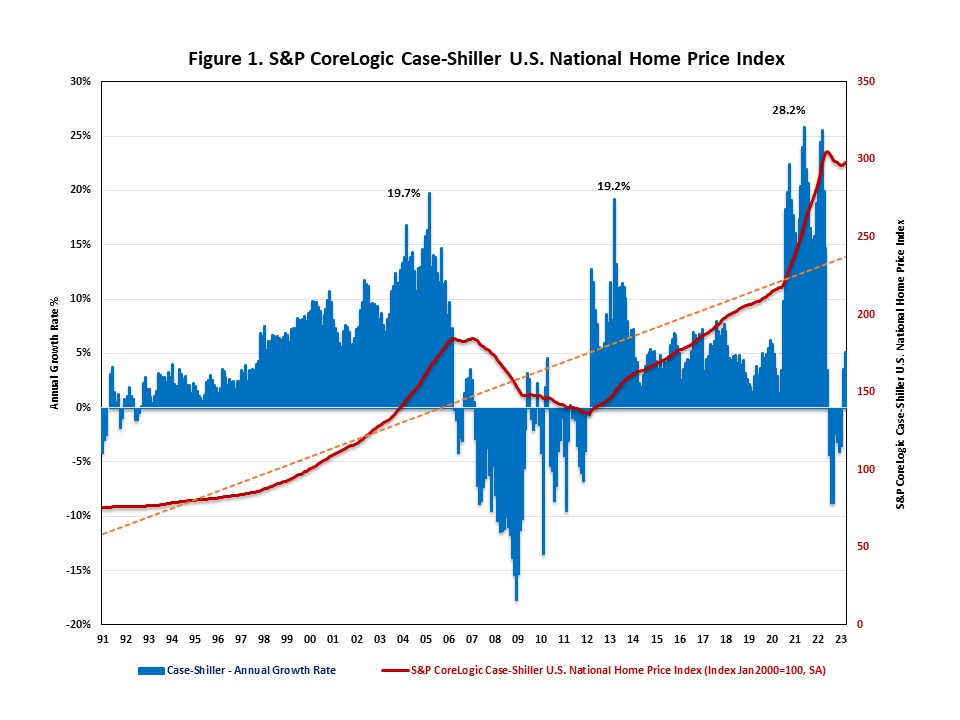
After seven consecutive months of decline, home prices climbed for a second straight month in March as low inventory levels persist. Locally, five metro areas, reported by S&P Dow Jones Indices, experienced negative home price appreciation in March.
The S&P CoreLogic Case-Shiller U.S. National Home Price Index, reported by S&P Dow Jones Indices, rose at a seasonally adjusted annual growth rate of 5.1% in March, following a 3.6% increase in February. After a decade of growth, home prices declined for seven consecutive months from July 2022 to January 2023, driven by elevated mortgage rates and weakening buyer demand. Nonetheless, national home prices are now 62% higher than their last peak during the housing boom in March 2006.
On a year-over-year basis, the S&P CoreLogic Case-Shiller U.S. National Home Price NSA Index posted a 0.7% annual gain in March, down from 2.1% in February. Year-over-year home price appreciation slowed for the twelfth consecutive month.
Meanwhile, the Home Price Index, released by the Federal Housing Finance Agency (FHFA), rose at a seasonally adjusted annual rate of 7.7% in March, following an 8.8% increase in February. On a year-over-year basis, the FHFA Home Price NSA Index rose by 3.7% in March, down from 4.3% in the previous month.

In addition to tracking national home price changes, S&P Dow Jones Indices reported home price indexes across 20 metro areas in March. In March, local home prices varied and their annual growth rates ranged from -10.3% to 18.5% in March. Among the 20 metro areas, nine metro areas exceeded the national average of 5.1%. Detroit, New York and San Diego had the highest home price appreciation. Detroit led the way with an 18.5% increase, followed by New York with a 13.9% increase and San Diego with a 12.7% increase.
Compared to the previous month, home prices in five metro areas declined in March. They were Dallas (-1.5%), Cleveland (-2.7%), Las Vegas (-4.2%), Phoenix (-4.5%) and Seattle (-10.3%).

Related


