
Yesterday’s US inflation data from the Bureau of Labor Statistics (July 12, 2023) – Consumer Price Index Summary – June 2023 – shows a further significant drop in the inflation rate as some of the key supply-side drivers continue to abate. The annual inflation rate is now back to 3 per cent and dropping fast. The risk now is that the conduct of the Federal Reserve will drive the US into a deflationary period with rising unemployment. Given that inflation peaked in the third-quarter 2022, that wages growth has been relatively subdued, and inflationary expectations’ survey evidence suggests no-one really thinks the inflation was going to endure, means that the US Federal Reserve’s logic is deeply flawed and not fit for purpose. They have been chasing an obsession that exists in a parallel universe to the real world. The risk is that they will continue to chase that obsession and use the fact that unemployment has still not risen much to claim there has to be higher unemployment. However, hopefully, the 3 per cent inflation rate result yesterday will cut-off any wild claims that they have to get the inflation down more quickly or risk a wages or expectations explosion. All cant of course.
The US inflation situation
The BLS published their latest monthly CPI yesterday which showed for June 2023 (seasonally adjusted):
- All Items CPI increased by 0.2 per cent over the month and 3 per cent over the year (down from 4.1 per cent in May).
- The peak monthly rise was 1.2 per cent in June 2022.
The BLS note that:
The index for shelter was the largest contributor to the monthly all items increase, accounting for over 70 percent of the increase, with the index for motor vehicle insurance also contributing.
The food index increased 0.1 percent in June after increasing 0.2 percent the previous month … The energy index rose 0.6 percent in June as the major energy component indexes were mixed.
The index for all items less food and energy rose 0.2 percent in June, the smallest 1-month increase in that index since August 2021 …
The all items index increased 3.0 percent for the 12 months ending June; this was the smallest 12-month increase since the period ending March 2021. The all items less food and energy index rose 4.8 percent over the last 12 months. The energy index decreased 16.7 percent for the 12 months ending June, and the food index increased 5.7 percent over the last year.
Summary: Inflation is falling fast in the US and that largely reflects the energy price dynamic which contributes in its own right but also by influencing other CPI components (for example, food delivery costs, etc).
Since the peak in August 2022, energy prices have fallen by 16.5 per cent.
Food prices are still rising, albeit at a much slower pace, as the lagged effects of the energy inflation is working its way through.
This inflation episode, while distorted by events no-one saw coming (Ukraine), is clearly a transitory phenomenon.
When I first conjectured about the sustainability of this episode, there was criticism.
I indicated at the time that ‘transitory’ doesn’t necessary mean a short period.
Rather, it meant that once the causal factors driving the inflation abated, we would see a sharp fall in the rates.
The other way of thinking about this is that a transitory episode is one where there is no on-going inflation being driven by real income resistance from capital and labour.
There clearly hasn’t been a wages component pushing this inflation along, unlike the 1970s.
The only qualification I would make is that we also didn’t anticipate the flagrant margin push from corporations even with benign wages growth that has led to some persistence.
There was an interesting paper published in the American Economic Association (AEA) Papers and Proceedings, in May 2023 – The Wage Phillips Curve under Labor Market Power (the link is to the Working Paper version) that came out in July 2022.
The authors wonder why “wages have grown slowly despite strong employment growth” in the US (and elsewhere of course).
They note that if the wages growth-unemployment rate relationship has become very flat (that is, large declines in the unemployment rate do not trigger rising inflation), then the attempt by central bankers to manipulate the unemployment rate to discipline inflation will be ineffective.
In theoretical terms, this casts the whole NAIRU story into doubt.
All that pushing up the unemployment rate will do is hurt those who lose their jobs and their families through income loss and stigma and will do little to reduce the inflation rate.
They “used online vacancy postings in the U.S.” to:
… study the interaction between labor market power and monetary policy. We show empirically that labor market power amplifies the labor demand effects of monetary policy, while not disproportionately affecting wage growth.
They found that:
1. “U.S. firms are well known to have significant labor market power, allowing them to “mark-down” wages from the marginal product of labor” – which means that US employers exploit the unequal power in the labour exchange to suppress wages below productivity growth and take more for themselves.
2. “accommodative monetary policy can lead to a decline in the unemployment rate that is decoupled from an increase in wage growth” – which means that when economic growth occurs, the unemployment rate falls but there is little wages growth.
3. It also means that when monetary policy is driving the unemployment rate up, there will be little impact on the inflation rate.
Which, in turn, means that central banks who follow the NAIRU narrative (that rising unemployment disciplines inflation) will keep pushing the interest rates up until they significantly increase the unemployment rate in a wasteful pursuit of lower inflation.
And in the current context, where the inflation is supply-driven anyway and has nothing much to do with wage pressure, that pursuit by central banks will be massively damaging to the unemployed while inflation will be declining independently (as the supply forces abate).
That is where we currently are heading if the central bankers don’t stop hiking rates.
Anyway, back to the current data release.
The following graph shows the importance of energy prices to the overall US inflation rate.
The simple regression line (dotted) yields an R2 of 0.48. That means that around 48 per cent of variation in the overall CPI is driven by energy price variation.
It is a little more complicated than that in statistical terms, but, that rough figure is a good guide to how influential energy prices are.
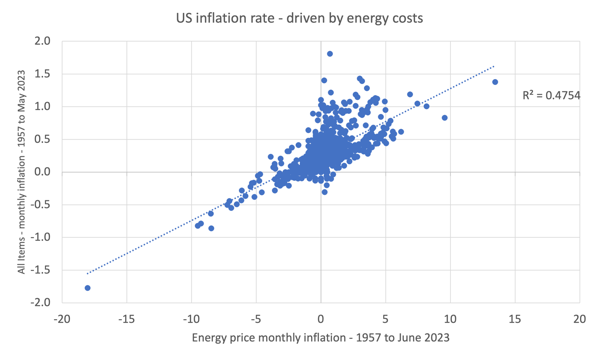
Effectively, the sharp drop in US inflation is down to the sharp drop in energy and petrol prices.
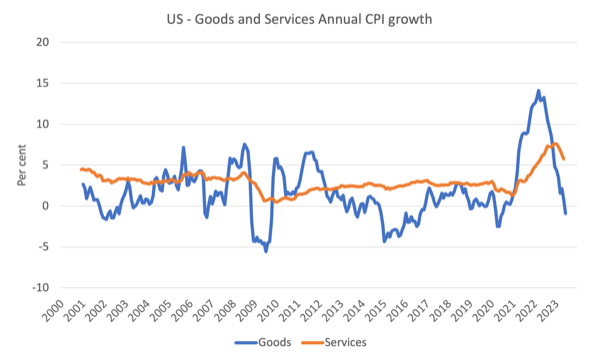
The next graph shows the evolution of annual price rises for the goods sector and for the services sector since 2000 – up to June 2023.
The contention always has been that the inflation has been largely driven and instigated by the supply factors that constrained the ability of the economy to meet demand for goods – the Covid factory and shipping disruptions and the like.
The graph shows clearly that those factors have been in retreat since the second-half of 2022 as the supply chain constraints ease.
The services sector, which is derivative of the supply drivers, lagged behind the goods sector and while still recording higher inflation that the goods sector, now has peaked and is also on the way down.
And the inflation has been falling sharply while the US labour market has been rather stable.
I analysed the latest Bureau of Labor Statistics employment release in this blog post – US labour market weakening – job openings fall and underemployment rises (July 10, 2023).
While there was a slight slowdown in employment growth there is no sign of a significant recession-type slowdown.
The point is that the lack of correspondence between the labour market dynamics and the inflation dynamics shows the poverty of the logic used by the Federal Reserve Bank to justify their interest rate rises.
That is reinforced by the research paper I discussed above.
The Federal Reserve logic is all about the strength of the labour market (they believe the actual unemployment rate is below the NAIRU) and that drives their zeal to create more unemployment and kill off wages growth, which, in turn, stops inflation in its track.
The data is thus not kind to the Federal Reserve logic.
Inflation is falling fairly quickly because the main drivers, which are not particularly interest rate sensitive, are in decline.
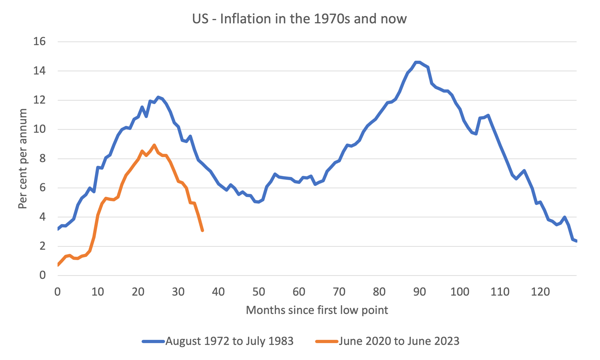
Consider the next graph, which shows the 1970s inflation episode, which effectively ran for just under 11 years from October 1972 to July 1983 and the current episode from June 2020 to June 2023 (current data).
The horizontal axis starts each series at the month that the inflation episode really began and then traces the evolution out by the months that follow.
In the first episode, the trace is from the low-point at the beginning (October 1972) to the next time that the inflation rate returned to that level (July 1983).
That event was drawn out.
The inflationary pressures were already emerging in the late 1960s as a result of the expenditure related to the prosecution of the Vietnam War.
It was starting to abate in early 1972, but really started to accelerate after the first OPEC oil shock in October 1973.
As you can see, before the situation could resolve, the wage-price pressures pushed the inflation rate back up and that was exacerbated by the second OPEC oil shock in late 1978 as a result of disruptions in oil supply due to the Iranian revolution.
By stark contrast, the current supply-driven episode did not have any additional propagation mechanisms at play (for example, wages pressure following the supply-side shocks) and that meant the inflation rate didn’t go close to the level reached in the 1970s and turned very quickly down.
It will be exhausted in about 40 months.
Conclusion
The inflation is burning out pretty quickly.
I consider my assessment that this was always going to be a transitory period of inflation has been validated by the data.
I also think we have reach peak lunacy in terms of our monetary policy understandings and practice.
That is enough for today!
(c) Copyright 2023 William Mitchell. All Rights Reserved.
