
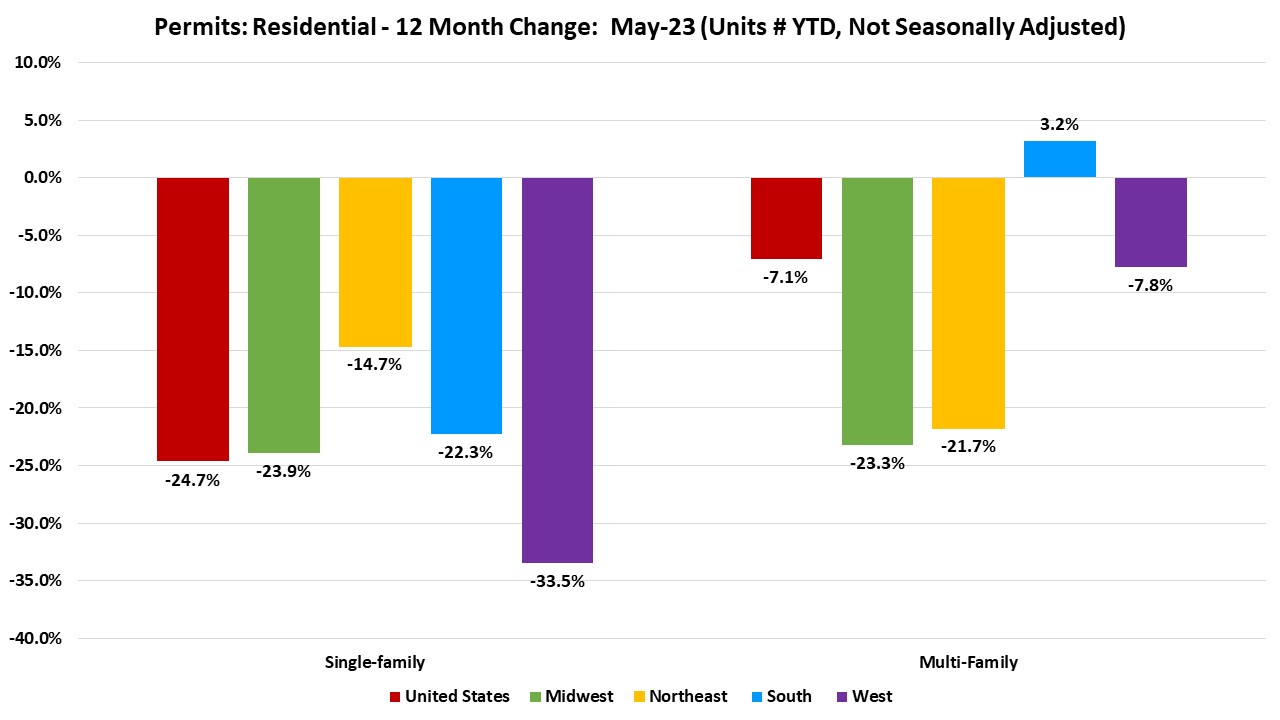
Over the first five months of 2023, the total number of single-family permits issued year-to-date (YTD) nationwide reached 357,143. On a year-over-year (YoY) basis, this is 24.7% below the May 2022 level of 473,997.

Year-to-date ending in May, single-family permits declined in all four regions. The Northeast posted the lowest decline of 14.7%, while the West region reported the steepest decline of 33.5%. The Midwest declined by 23.9% and the South declined by 22.3% in single-family permits during this time. For multifamily permits, the South is the only region to post a modest increase of 3.2% while the other three regions posted declines. Multifamily permits in the West were down 7.8%, down in the Northeast by 21.7%, and down in Midwest by 23.3%.
Between May 2022 YTD and May 2023 YTD, except for Hawaii, all the other states and the District of Columbia reported declines in single-family permits. Hawaii posted a 25.3% increase while the other states posted declines ranging from 0.5% in New Jersey to 64.6% in Alaska. The ten states issuing the highest number of single-family permits combined accounted for 64.4% of the total single-family permits issued. Texas, the state with the highest number of single-family permits issued, declined 27.6% in the past 12 months while the next two highest states, Florida and North Carolina declined by 23.8% and 14.8% respectively.

Year-to-date, ending in May, the total number of multifamily permits issued nationwide reached 247,005. This is 7.1% below the May 2022 level of 265,751.
Between May 2022 YTD and May 2023 YTD, 19 states recorded growth, while 31 states and the District of Columbia recorded a decline in multifamily permits. North Dakota led the way with a sharp rise in multifamily permits from 105 to 668 while Hawaii had the largest decline of 62.0% from 737 to 280. The ten states issuing the highest number of multifamily permits combined accounted for 65.1% of the multifamily permits issued. Texas, the state with the highest number of multifamily permits issued, declined 5.8% in the past 12 months while the next two highest states, Florida and California increased by 7.8% and 2.2% respectively.
 At the local level, below are the top ten metro areas that issued the highest number of single-family permits.
| Top 10 Largest SF Markets | May-23 (# of units YTD, NSA) | YTD % Change (compared to May-22) |
| Houston-The Woodlands-Sugar Land, TX | 20,366 | -17% |
| Dallas-Fort Worth-Arlington, TX | 16,187 | -27% |
| Atlanta-Sandy Springs-Roswell, GA | 9,766 | -22% |
| Phoenix-Mesa-Scottsdale, AZ | 8,878 | -43% |
| Charlotte-Concord-Gastonia, NC-SC | 7,905 | -19% |
| Orlando-Kissimmee-Sanford, FL | 6,933 | -16% |
| Austin-Round Rock, TX | 6,256 | -41% |
| Nashville-Davidson–Murfreesboro–Franklin, TN | 5,929 | -25% |
| Tampa-St. Petersburg-Clearwater, FL | 5,634 | -19% |
| Raleigh, NC | 5,425 | -16% |
For multifamily permits, below are the top ten local areas that issued the highest number of permits.
| Top 10 Largest MF Markets | May-23 (# of units YTD, NSA) | YTD % Change (compared to May-22) |
| New York-Newark-Jersey City, NY-NJ-PA | 13,932 | -32% |
| Dallas-Fort Worth-Arlington, TX | 11,173 | -7% |
| Houston-The Woodlands-Sugar Land, TX | 9,513 | 15% |
| Phoenix-Mesa-Scottsdale, AZ | 8,339 | 30% |
| Atlanta-Sandy Springs-Roswell, GA | 7,855 | 18% |
| Austin-Round Rock, TX | 7,372 | -33% |
| Miami-Fort Lauderdale-West Palm Beach, FL | 7,112 | 14% |
| Los Angeles-Long Beach-Anaheim, CA | 7,071 | -12% |
| Charlotte-Concord-Gastonia, NC-SC | 5,841 | 28% |
| Denver-Aurora-Lakewood, CO | 5,744 | 4% |
Related
