

Who CAN invest in Small Cap Funds? What risks are associated with Small Cap Fund investments? Let’s uncover insights by analyzing the last 18 years of data.
After the recent performance of small-cap funds, for many investors small-cap funds turned into NEED. Many who missed to invest in small-cap funds are suffering from FOMO (Fear Of Missing Out) phobia.
For the majority of investors past performance is the only criterion to choose the asset classes or products. Risk analysis comes secondary for many investors.
Who CAN invest in Small Cap Funds?
For this study purpose, I have taken the data of Nifty 50 TRI, Nifty Midcap 150 TRI, and Nifty Smallcap 250 TRI from 1st April 2005 to 9th August 2023. The purpose of choosing the 1st April 2005 date is Nifty Smallcap 250 index data is available from that date. Hence, to have uniformity in comparison, I have taken the data for all three indices from 1st April 2005. Hence, we have daily data points of 4,554. Using this data, let us try to find the answer of who can invest in small-cap funds and what are the risks involved in small-cap funds.
Let us first understand what may be the value of Rs.1,00,000 invested in Nifty 50 TRI, Nifty Midcap 150 TRI, and Nifty Smallcap 250 TRI on 1st April 2005 and waited till yesterday i.e. 9th August 2023.
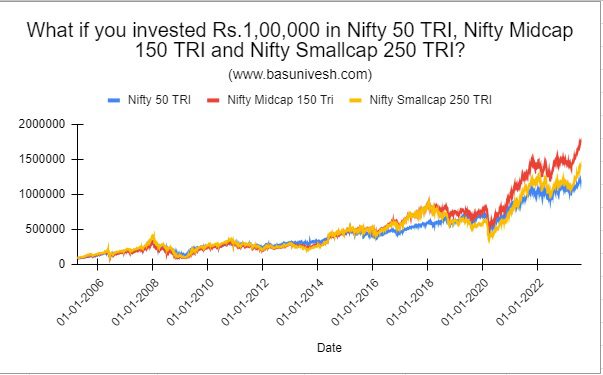
Notice the performance of these 18 years of all three indices. You will find that mid and small-cap performance actually started from the Covid period and consistently performed well above the Nifty 50 TRI index.
Rs.1,00,000 invested on 1st April 2005 in Nifty 50 TRI is currently valued at Rs.11,95,287, in Nifty Midcap 150 TRI it is Rs.17,85,825 and in Nifty Smallcap 250 TRI it is Rs.14,32,578. Looks like during past 18 years Midcap is actually a winner than Smallcap 
However, don’t look at the above rosy picture alone. Instead, let us try to understand the drawdown of the values from its peak.
Drawdown refers to the peak-to-trough decline or reduction in the value of an investment or portfolio. It represents the largest percentage drop from a previous high point to the lowest point before a recovery in value occurs. Drawdown is commonly used to assess the potential risk and volatility of an investment, as it provides insight into the extent of losses an investment might experience during a certain period. It’s an important metric for investors, traders, and fund managers to understand and manage the potential downside of their investments.
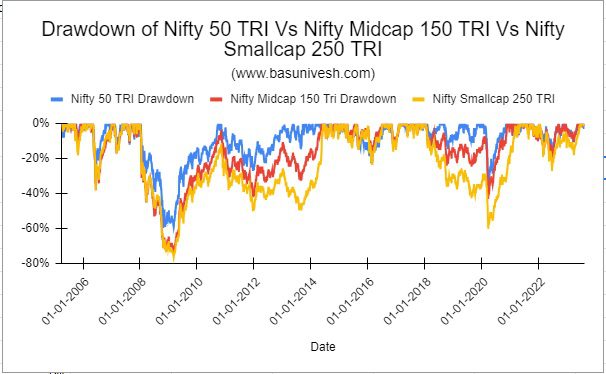
Just look at the value drop during the 2008 market crash and also during the 2020 Covid market crash. In the 2008 market crash, the downfall for small-cap was almost around 80% and during the 2020 market crash, it was around 60%.
Are you able to sustain such a loss in your portfolio? If the answer is YES, then you CAN invest in small-cap funds.
Now in the above chart, I have shown the journey of an investor who invested on 1st April 2005 and holding his investments up to 9th August 2023. However, in reality, how many investors holding for 18 years? Very few sustained a shock of around 80% and a 60% downfall in their invested value.
Hence, to understand the various frequency of holding periods during this 18 years journey, let us calculate the rolling returns for 1-year, 3 years, 5 years, and 10 years periods.
Rolling returns, also known as rolling time periods or rolling performance, refer to a method of measuring the historical performance of an investment or portfolio over different consecutive time periods. Instead of looking at the overall return over the entire investment horizon, rolling returns involve analyzing the returns over a series of overlapping periods.
For example, if you want to calculate rolling one-year returns for a 10-year period, you would start with the first year and calculate the annualized return. Then, you would move the time frame forward by one year and calculate the annualized return for the new one-year period. This process is repeated for each consecutive period, essentially “rolling” the time frame forward one period at a time.
Rolling returns provide a more dynamic and granular view of an investment’s performance over various market conditions. This approach helps investors and analysts identify patterns, trends, and fluctuations in returns that might not be evident when looking at a single overall return. It can offer insights into how an investment performs in different market environments and can be useful for assessing long-term consistency and volatility.
1-Year Rolling Returns of Nifty 50 TRI Vs Nifty Midcap 150 TRI Vs Nifty Smallcap 250 TRI
Look at the below chart of 1 Year rolling returns.
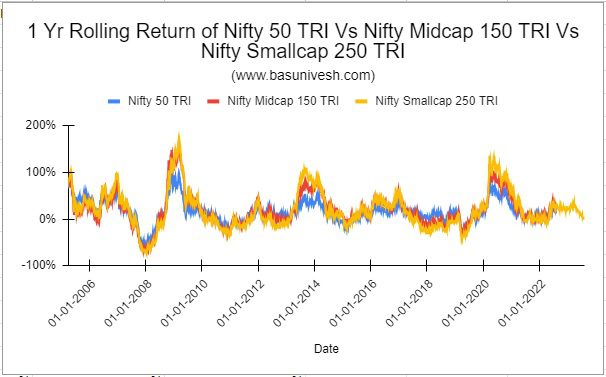
You noticed that for Nifty 50 TRI, the maximum 1 year return is 100%, minimum 1 year return is 55% and average is 16%. For Nifty Midcap 150 TRI, the maximum 1 year return is 169%, minimum is -67% and average is 20%. For Nifty Smallcap 250 TRI, the maximum 1 year return is 175% and minimum is -70% and the average is 20%. It shows that by investing in smallcap you are actually creating a risk with no extra great returns compared to midcap.
3 Years Rolling Returns of Nifty 50 TRI Vs Nifty Midcap 150 TRI Vs Nifty Smallcap 250 TRI
Now let us look into the results of 3 years of rolling returns.
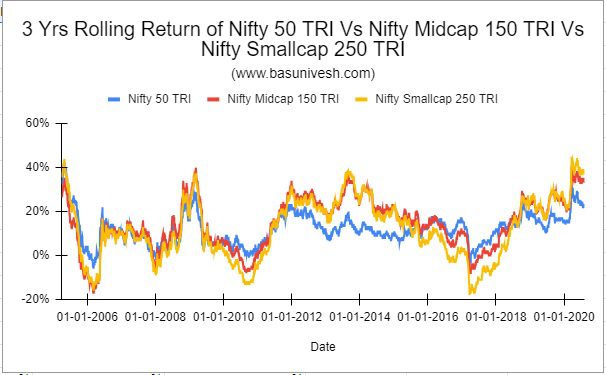
You noticed that for Nifty 50 TRI, the maximum 3 years return is 42%, minimum 3 years return is -6% and average is 12%. For Nifty Midcap 150 TRI, the maximum 3 years return is 41%, minimum is -17% and average is 14%. For Nifty Smallcap 250 TRI, the maximum 3 years return is 45% and minimum is -18% and the average is 12%. Again the resuls showing that by investing in smallcap you are actually creating a risk with no extra great returns compared to midcap.
5 Years Rolling Returns of Nifty 50 TRI Vs Nifty Midcap 150 TRI Vs Nifty Smallcap 250 TRI
Let us now look at 5 years rolling returns data.
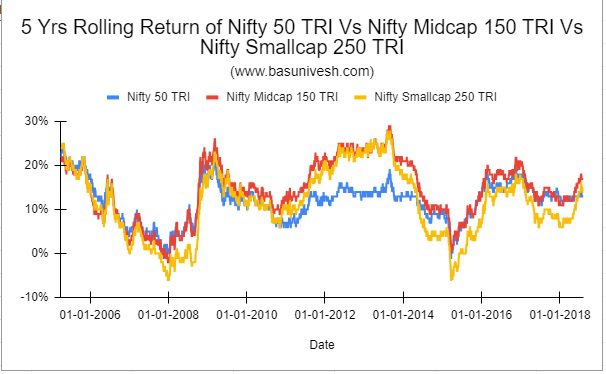
The 5 years maximum return for Nifty 50 TRI is 24%, minimum is -1% and the average is 11%. For Nifty Midcap 150 TRI, maximum is 29%, minimum is -2% and the average is 14%. For Nifty Smallcap 250 TRI, maximum is 28%, minimum is 6% and the average is 11%.
This shows that by investing in small cap you are taking undue risk with no great returns.
10 Years Rolling Returns of Nifty 50 TRI Vs Nifty Midcap 150 TRI Vs Nifty Smallcap 250 TRI
Let us look at 10 years rolling returns data.
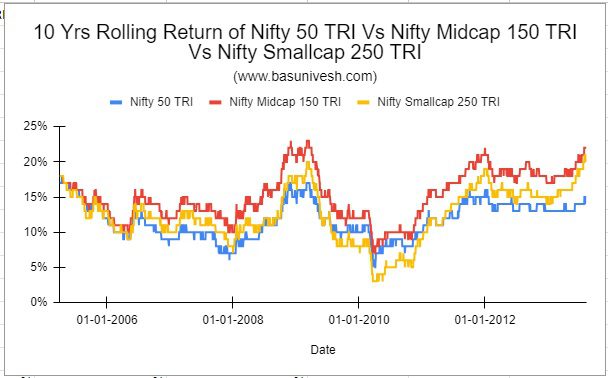
For Nifty 50 TRI, the maximum 10 years return is 18%, minimum is 5% and the average is 11%. For Nifty Midcap 150 TRI, the maximum is 23%, minimum is 7% and the average is 15%. For Nifty Smallcap 250 TRI, the maximum is 21%, minimum is 3% and the average is 12%.
Considering all these results, we can conclude that by investing in smallcap just because of the recent performance, you are actually taking the undue risk with no guarantee of high returns compared to midcap.
However, if you are fine with the huge risk with little bit of high return, then you can explore the smallcap with a long term time horizon (decades). But as per me, it is UNNECESSARY!!
