Your friends, neighbors, and ex-partners are all over social media—they seem to be jetting off on vacation every two weeks or going to exclusive events in their fancy new clothes. And you’re left thinking—am I the only one who can barely afford Netflix?
Most likely, you’re not—43% of Americans say they struggle to meet basic needs, let alone pay a Netflix subscription. So, forget about what you see online—let’s explore the real personal finances of Americans across the country.
In this article you will find information about:
- Financial Well-Being
- Breakdown of Income
- American Savings
- American Spending Statistics
- Personal Finance and Bills
- Household Budget and Expenses
- Banking and Credit
- Average American Debt
- Personal Finance Loans
- Retirement Planning Statistics
- Racial Differences
- Overview
Financial Well-Being
Everyone complains about money—we either want more, or we don’t have enough. But how happy (or unhappy) Americans are when it comes to their personal finances?
- Starting on a positive note, a 2021 survey involving 11,000 US residents found 78% of adults were either doing okay or living comfortably financially—the highest level since 2013. (Federal Reserve)
- Three-fourths of parents reported they were doing okay financially—an eight percentage point increase from 2020. (Federal Reserve)
- However, only 48% of adults rated their local economy as “good” or “excellent.”(Federal Reserve)
- Another large survey of 9,658 US employees found 30% struggle financially—and 43% struggle to meet basic needs. (Willis Towers Watson)
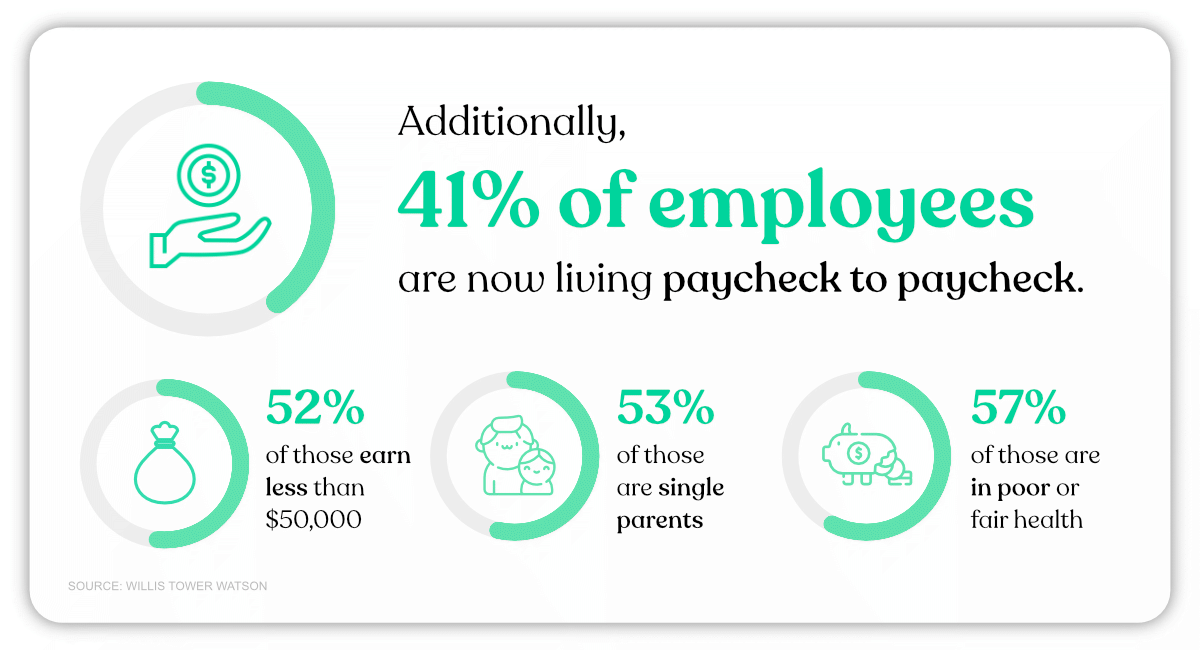
- Additionally, 41% of employees are now living paycheck to paycheck—an increase of 3% since 2019. (Willis Towers Watson)
- Of those living paycheck to paycheck, 52% earn less than $50,000, 53% are single parents, and 57% are in poor or fair health. (Willis Towers Watson)
- A 2022 third-quarter survey also saw worsening results, with 37% of adults reporting struggling financially, a 15-point percentage increase from the first quarter. (Ramsey Solutions)
- Similarly, in a 2022 survey involving 1,236 Americans, 37% also said their personal family finances are worse than last year. (Marist Poll)
- The same survey found those with a bachelor’s degree were more likely to be doing okay better financially than those with less than a high school degree. (Marist Poll)
- Personal finances are also connected to mental health, with another survey finding 32% of Americans cite money as their biggest source of stress—an increase from 22% in 2021. (ValuePenguin)
- As for age differences, 39% of Gen Z chose money as their primary source of stress, followed by 38% of millennials, 32% of Gen X, and 26% of baby boomers. (ValuePenguin)
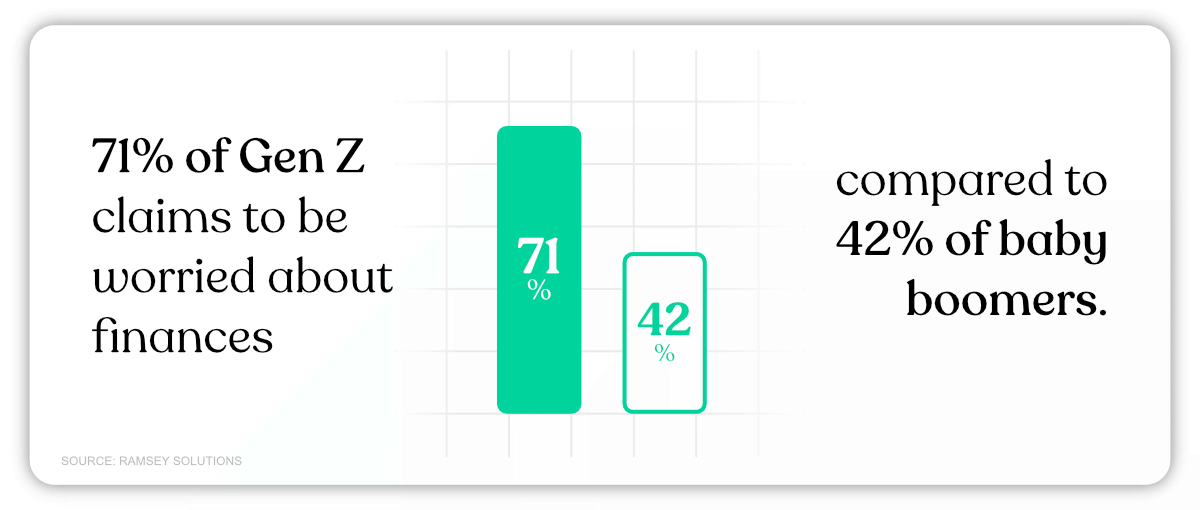
- A survey involving 3,011 adults also found younger generations are more stressed about money, with 71% of Gen Z claiming to be worried about finances, compared to 42% of baby boomers. (Ramsey Solutions)
- Generally, 59% of Americans say they worry about finances daily, and about 50% have struggled with sleeping issues because of financial stress. (Ramsey Solutions)
- Despite this, a 2022 survey with 2,381 Americans discovered that 60% prioritize their personal fulfillment over their salary and income potential. (Northern Mutual)
- Looking to the future, 84% of Americans are worried about how a potential recession will affect their household, with 75% saying it would negatively impact them. (Ramsey Solutions)
- When asked about future generations, a 2022 survey revealed that 70% of adults in 19 countries believed the children in their country would be worse off than their parents. (Pew Center)
Check out more key statistics:
Breakdown of Income
Some prefer to keep their income a closely guarded secret for fear of judgment, envy, or pity. We’re going to expose the salary secrets and break down the average earnings of workers across America— 
- In 2022, the average American made $55,640 a year. (Bureau of Labor Statistics)
- Personal income has increased by 9.0% from 2020 to 2022. (BEA.gov)
- The Q3 2022 report by the US Department of Labor says that the median weekly wage for full-time workers is currently $1,070. (Bureau of Labor Statistics)
- However, gender differences are evident, with men earning a weekly salary of $1,164, compared to $971 of women’s weekly earnings. (Bureau of Labor Statistics)
- As for age differences, median weekly earnings for men between the ages of 45 to 54 were $1,398, followed by $1,346 for ages 55 to 64 and $1,299 for ages 35 to 44. (Bureau of Labor Statistics)
- In contrast, for women, weekly earnings were highest at $1,086 for those aged 35 to 44 and $1,071 for those aged 45 to 54. (Bureau of Labor Statistics)
- Those employed in management, professional, and related occupations had median weekly earnings of $1,735 for men and $1,296 for women. (Bureau of Labor Statistics)
- Those who held at least a bachelor’s degree were the highest earner, with a median weekly wage of $1,556. This was followed by high-school graduates with no college education at $866 and those without a high-school diploma at $692. (Bureau of Labor Statistics)
- When looking at wealth distribution, 68% of the United States’ total wealth is owned by the top 10% of earners, whereas the lowest 50% of earners only hold 3.2% of the country’s total wealth. (Statista)
American Savings
Many of us fit into one of two categories—living in the moment or planning ahead. The statistics seem to reflect this. While many Americans are successfully saving, plenty claim to have no savings at all—
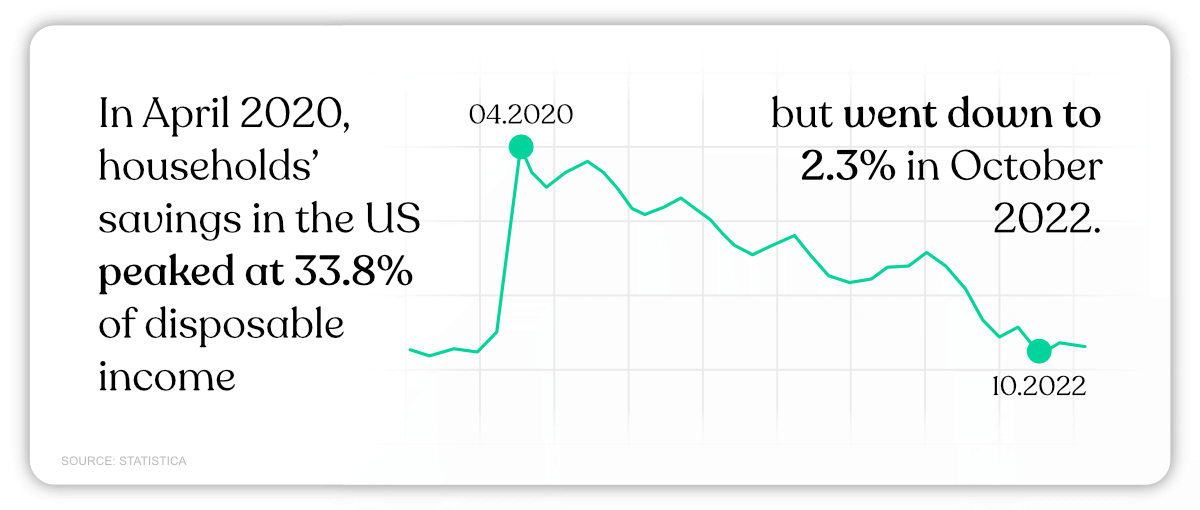
- Personal savings have fluctuated recently, largely due to the pandemic. In April 2020, households’ savings in the US peaked at 33.8% of disposable income but went down to 2.3% in October 2022. (Statistica)
- A survey involving 5,000 Americans from every state discovered that 58% claim COVID–19 had changed their approach to savings, and 53% say they’ve begun saving for different things. (Slickdeals)
- The same survey found that the average American has $17,135 in savings or in an investment account. (Slickdeals)
- Another 2022 survey involving 3,011 Americans found that 45% have at least $1,000 in savings, although 36% claim to have no savings. (Ramsey Solutions)
- Around 13% of the population has no emergency savings (Inside 1031)
- For those with savings, 32% claimed their top priority was saving for some kind of emergency, while 31% cited retirement and 20% for a new car. (Slickdeals)
- In a Middle-Income Financial Security survey, 70% believed it would be difficult to save for the future, and only 53% felt confident about their overall financial situation. (Primerica)
- A survey involving 2,381 Americans revealed 33% expect to live to 100, but 33% believe there is more than a 50% chance they will outlive their savings. (Northern Mutual)
- And 36% say they are not currently taking any steps to prevent the possibility of outliving their savings. (Northern Mutual)
- Another survey found Americans are making more effort to save money, with 59% stating they are cutting back on spending. (Slickdeals)

- Across all states, New Yorkers were found to be the most savings-conscious, with an average of 14.5% of their income going toward savings or investment accounts. (Slickdeals)
- To save money, a survey with 1,546 adults found that 75% are cutting back on non-essentials, and 43% are delaying regular car or home maintenance (Primerica)
- However, it was also discovered that 34% are tapping into their savings, and 29% are increasing their credit card use. (Primerica)
- Another survey involving 1,236 Americans also found that 11% have been forced to use significant savings to make ends meet. (Marist Poll)
For more surprising stats on how Americans save money, read the Savings Statistics article.
American Spending Statistics
Calculating how much you’ve spent on medical care or food expenses can be an impossible task (and one that you likely want to avoid). But if you’re curious, here’s an overview of what Americans are spending their hard-earned cash on— 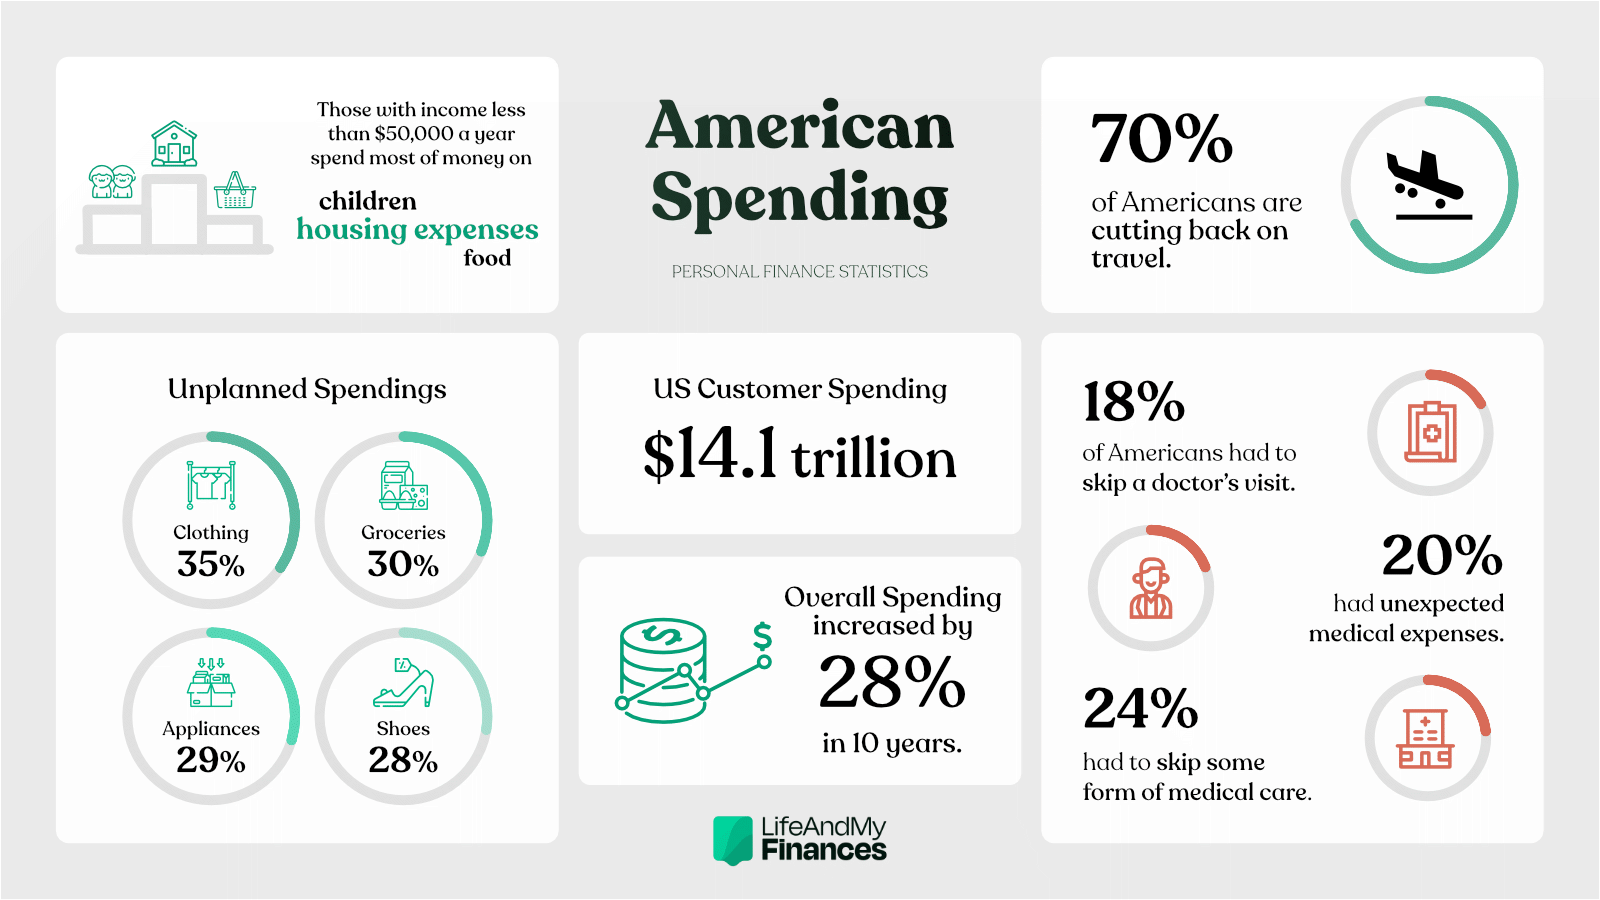
- Consumer spending in the United States currently stands at $14.1 trillion in Q2 2022, and overall spending has increased by 28% over the last ten years. (Trading Economics)
- A 2021 survey involving those with an annual income of less than $50,000, says 30% spent most of their credit on housing expenses, while 20% spent most on their children and 15% on food. (Federal Reserve)
- Common unplanned purchases in 2022 include clothing (35%), food and groceries (30%), household items (29%), shoes (28%), and consumer technology (27%). (PR Newswire)
- Interestingly, another survey found 14.4% reported spending more than $40 a month in coffee shops, while 11.4% spend at least $40 a month making coffee at home. (Statistica)
- However, many are also trying to cut back on their expenses, with 72% saying they have cut back on at least one necessity or nicety in the last six months to afford their monthly expenses. (Marist Poll)
- To cut back, 54% of Americans say they have eaten out less, 40% have driven less or carpooled to save on gas, 39% have cut back on food expenses, and 35% have skipped vacation or other travel plans. (Marist Poll)
- A survey with 3,011 US adults found 70% are cutting back on travel to help make ends meet. (Ramsey Solutions)
- 18% of Americans said they were forced to skip a doctor’s visit or prescription drug. (Marist Poll)
- A 2021 survey also found that 20% of Americans had unexpected medical expenses in the last year, averaging between $1,000 to $1,999, while 24% of adults had to skip some form of medical care because they couldn’t afford the expenses—a 1% increase from 2020. (Federal Reserve)
- 23% of US employees struggled to pay for housing and 19% for healthy food. (Willis Towers Watson)
- Americans also faced costly weather events, with 16% claiming they had suffered financial hardship because of a natural disaster or severe weather event within the last year. (Federal Reserve)
- Other struggles included financial fraud or scams, with 16% claiming to be victims, while 13% have incurred significant expenses due to divorce or separation. (Willis Towers Watson)
Personal Finance and Bills
Nobody likes bills—but it can be reassuring to know you’re not the only one who has difficulties paying everything off. Here’s a bill breakdown and whether we’re actually paying them—
- An extensive survey involving 11,000 Americans found that 15%, with an income under $50k, had struggled to pay their bills due to a varying monthly income. (Federal Reserve)
- Amongst parents earning less than $50k, this figure increased to 27%. (Federal Reserve)
- Similarly, a 2022 survey found that nearly 18% of Americans have delayed or skipped paying at least one bill in the past six months. (Marist Poll)
- Of those who have skipped bills, 9% claim to have avoided paying medical bills or insurance, while 9% have delayed or missed credit card payments. (Marist Poll)
- A survey of 3,011 adults also discovered that one in three were struggling or in crisis due to their personal finances, with over 50% struggling to pay their bills. (Ramsey Solutions)

Household Budget and Expenses
Housing expenses make up a large portion of our overall expenditure—from mortgage bills to rental prices. How much are Americans spending on their household?
- A Q3 2022 report found there was $633 billion in newly originated mortgage debt, the closest figure yet to pre-pandemic volumes. (Federal Reserve)
- Despite this decrease, another survey found one in four Americans who earn less than $25,000 annually have missed a mortgage or rent payment. (Marist Poll)
- Amongst those living with adult children, 63% say they pay over half the rent or mortgage, including 51% who say they pay the full payment. (Pew Research Center)
- In addition, 30% of adults living with their parents say they pay nothing towards rent or mortgage. (Pew Research Center)

- Housing expenses are also a leading source of stress, with 64% struggling to cover their rent—a 15-point percentage increase from mid-2021. (Ramsey Solutions)
- Moreover, 65% of Americans believe it’s more difficult to own a home now compared to past decades. (Ramsey Solutions)
- Likewise, 51% claimed the American Dream of owning their own home isn’t within reach for most adults. (Ramsey Solutions)
Banking and Credit
Almost everyone has a bank account nowadays, and credit cards are becoming more popular due to increasing accessibility. But these come with overdraft fees and credit card balances— 
- A 2021 survey revealed only 6% of adults in the US don’t have a bank account. (Federal Reserve)
- 24% of adults with less than a high school degree and 17% with an income below $25,000 didn’t have a bank account. (Federal Reserve)
- A survey of 11,000 people found that 11% of those with a bank account had paid an overdraft fee within the last year, mostly comprising low-income adults. (Federal Reserve)
- In 2021, 84% of adults had a credit card (as well as almost everyone with an income over $100,000). (Federal Reserve)
- Additionally, a Q3 2022 survey says that 25% of Americans rely on credit cards more than usual to pay their bills, while 16% said they rely on credit cards less than normal. Credit card balances increased by $38 billion from last year—the largest yearly increase in 20 years. (Ramsey Solutions)
- More than half of Americans (55%) carry a credit card balance from month to month. (Inside 1031)
Average American Debt
Debt can be hard to control—especially if you’re someone who likes to avoid it for as long as possible. With public debt currently at 31,238 trillion dollars, you wouldn’t be the only one with debt hanging over your head—
- Credit card debt is also on the rise, with 37% of Americans reportedly taking on more credit card debt. (Primerica)
- The average credit card debt of Americans in 2022 is $5,221. (Experian)

- And around 39% of Americans believe they’ll be able to pay off all credit card debt within the next year. (GOBankingRates)
- One in five Americans has increased debt since June 2022, while 24% say they’ve reduced their debt. (Ramsey Solutions)
- Educational debt remains prevalent, with 30% of adults saying they’ve experienced at least some form of debt from their education. (Federal Reserve)
- The median amount of education debt was between $20,000 to $24,000 in 2021, with most students paying less than $25,000 on their loans. (Federal Reserve)
- Of those with outstanding education debt, only 12% were behind on their payments (a 5% drop from the previous year). (Federal Reserve)
- 77% of adults believe at least some of their student debt will be forgiven by the federal government. (Ramsey Solutions)
Personal Finance Loans
Personal loans can help you get a car, a house, and an education. They can be great—until you have to pay it back. Despite pay-back dates and interest rates, statistics show that loans and the associated debt aren’t going anywhere—
- In the Economic Well-Being of US Households 2021 survey, 12% of loan borrowers were behind on their payments—a decrease from 17% in late 2021. (Federal Reserve)
- $185 billion was the volume of newly originated auto loans—a slight drop from the previous quarter, but still high compared to pre-pandemic years. (Federal Reserve)
- Loans for education are still the most popular., A survey of 11,874 adults says that those under 30 who went to college were more likely to take out loans than older adults. (Federal Reserve)
- As for student loans, a 2022 survey revealed student loan balances had decreased slightly to $1.57 trillion. (Federal Reserve)

- 73% of those who went to college with student loan debt claimed they were doing okay financially in 2021. (Federal Reserve)
- Around 50% of those with student debt claim that the Biden administration’s student loan forgiveness program will help eliminate their student loans. (Ramsey Solutions)
Retirement Planning Statistics
With the retirement age going up and the cost of living rising, retiring to a sunny beach in Florida can feel like nothing more than a dream—
- A 2021 survey of 11,000 American adults found 40% of non-retirees believed their retirement savings was on track, an increase from 36% in 2020. (Federal Reserve)
- On average, US adults in 2022 believe they’ll need $1.5 million to retire comfortably, which is a 20% increase from the $1,047,200 average in 2021. (Northern Mutual)
- The average retirement savings stand at $86,869 in 2022, an 11% decrease from $98,000 in 2021. (Northern Mutual)

- The average retirement age has increased to 64, compared to 62.6 in 2021. (Northern Mutual)
- The pandemic has shifted attitudes toward retirement—25% who retired a year ago (and 15% who retired two years ago) said factors related to Covid-19 contributed to their reasons for retiring. (Federal Reserve)
- In a survey of 2,381 Americans, 25% said they were planning to retire later than expected (15% plan to retire sooner). (Northern Mutual)
- Only 35% of Americans believe they’ll be able to retire at all. (Slickdeals)
- Overall, Gen Z and millennials were the most likely to believe they won’t be able to retire in the future. (Slickdeals)
- You can tell people are worried about retirement from a 2022 survey—43% claimed they don’t expect to be financially prepared for retirement, with 45% saying they can imagine a future without Social Security. (Northern Mutual)
- Out of those without an IRA or retirement plan, 52% claim they can’t afford to save for retirement, and only 19% believe they have enough to retire comfortably. (Primerica)
- 81% of those already retired say they’re doing at least okay financially, and 60% report high levels of life satisfaction. (Federal Reserve)
Racial Differences
It’s unfortunate, but statistics show that minority groups often come off financially worse than their white counterparts. Here are some key differences—
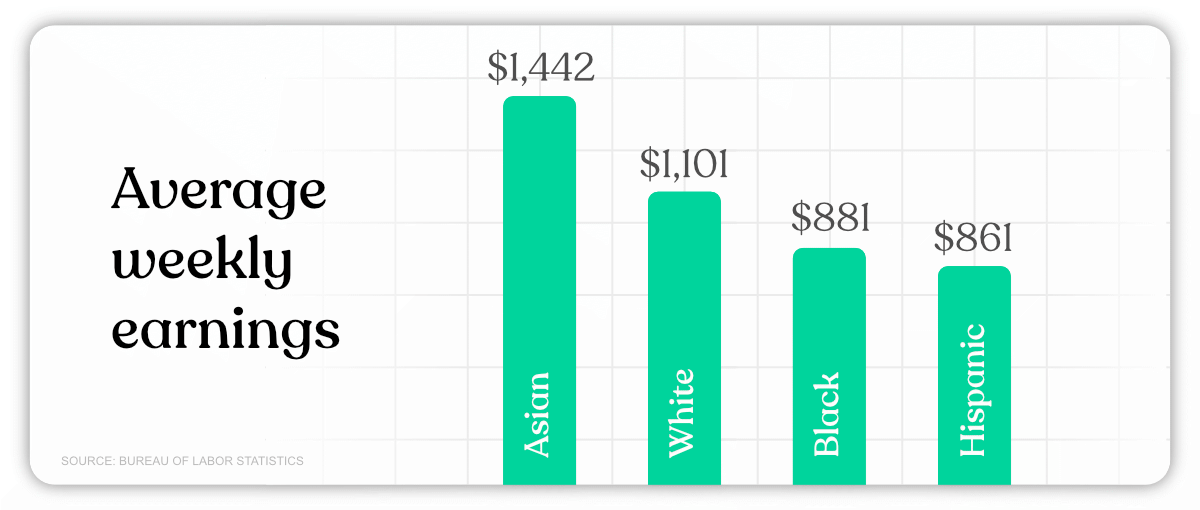
- The US Department of Labor revealed in 2022 that Asian people had average weekly earnings of $1,442, followed by White people with $1,101, Black people with $881, and Hispanic people with $861. (Bureau of Labor Statistics)
- The report also noted that Caucasian women earned 83.1% as much as Caucasian men (compared to 90% for Black women, 86.1% for Hispanic women, and 71.1% for Asian women). (Bureau of Labor Statistics)
- As for savings, White and Asian groups were most likely to say they were on track to retire with enough retirement savings than Black and Hispanic groups. (Federal Reserve)
- Only 36% of Black Americans say they have a three-month emergency fund, compared to 54% belonging to other ethnic groups. (Pew Research Center)
- A survey of 11,874 US residents found that Black or Hispanic adults with a bank account were most likely to pay an overdraft fee within the last year, compared to only 3% of Asian adults. (Federal Reserve)
- Credit card usage also differs, with one in four Asian adults reportedly carrying a balance at least once on their credit card in the last year. (Federal Reserve)
- A survey of 10,371 adults said Black and Hispanic adults were the least likely to have a bank account, at 13% and 11%, respectively. (Pew Research Center)
- The same survey found that 43% of Asian adults had heard a lot about cryptocurrency, compared to 29% of Hispanic adults and about a quarter of Black or White adults. (Pew Research Center)
- Research has also showed that 60% of Black Americans say their finances meet basic needs, as opposed to 71% of all Americans. (Pew Research Center)
- Generally, 88% of Asian adults reported doing okay financially, followed by 81% of White adults, 71% of Hispanic adults, and 68% of Black adults—with Hispanic Americans showing the most significant increase from the previous year. (Pew Research Center)
Overview
If you’ve made it through all our personal finance statistics, you’re either feeling less alone, more self-assured, or—absolutely terrified. Just in case you fall into the latter category (and your finances make you sweat), here are some top tools to help you manage your personal finances and say goodbye to your money worries.


