Here’s a whopping list of 250+ sales statistics across 25 different categories. We’ve scoured numerous rabbit holes on the internet, scanned reports, and examined credible studies, to compile the most comprehensive list of sales statistics. We raked through the most trusted sources, like The Harvard Business Review, The Pew Research Center, HubSpot, and more, so you don’t have to.
Whether you’re a seasoned sales professional or a newbie, these statistics will help you:
- Understand key trends within the sales landscape.
- Exercise smart prospecting, customer outreach, and productivity.
- Sell smarter.
Worried about navigating through this humongous stats list? Fret not. We’ve categorized the statistics into 25 mini-sections to help you find information faster.
- Sales Prospecting Statistics
- Lead Management Statistics
- Sales Follow-Up Statistics
- Sales Email Statistics
- Cold Calling Statistics
- Social Selling Statistics
- Online And Ecommerce Sales Statistics
- Digital Marketing Stats
- Sales Productivity Statistics
- Referral Sales Statistics
- Sales Career Statistics
- Inside Sales Statistics
- Outside Sales Statistics
- Sales CRM Statistics
- Sales Closing Stats
- Inbound And Outbound Sales Statistics
- Sales Coaching Statistics
- Door-to-Door Sales Statistics
- Sales Conversion Rate Statistics
- Sales Challenges Statistics
- Brand-Related Sales Statistics
- US Retail Sales Statistics
- Home Sales Statistics
- App Sales Statistics
- Sales Trivia
- Wrapping Up
1. Sales Prospecting Statistics
We’re starting with the first step in the sales process—prospecting. We get it. Nobody loves digging for potential customers. But prospecting is vital to your sales funnel. When done right, you attract high-quality leads who you can easily convert into buyers. So, how long should you spend on prospecting? When is the best time to do it? Read on to find out.
- Top sellers spend an average of 6 hours each week researching their prospects. (Crunchbase)
- Budget and need are the two most significant factors that lead to a prospect connecting with a rep. (RAIN Group)
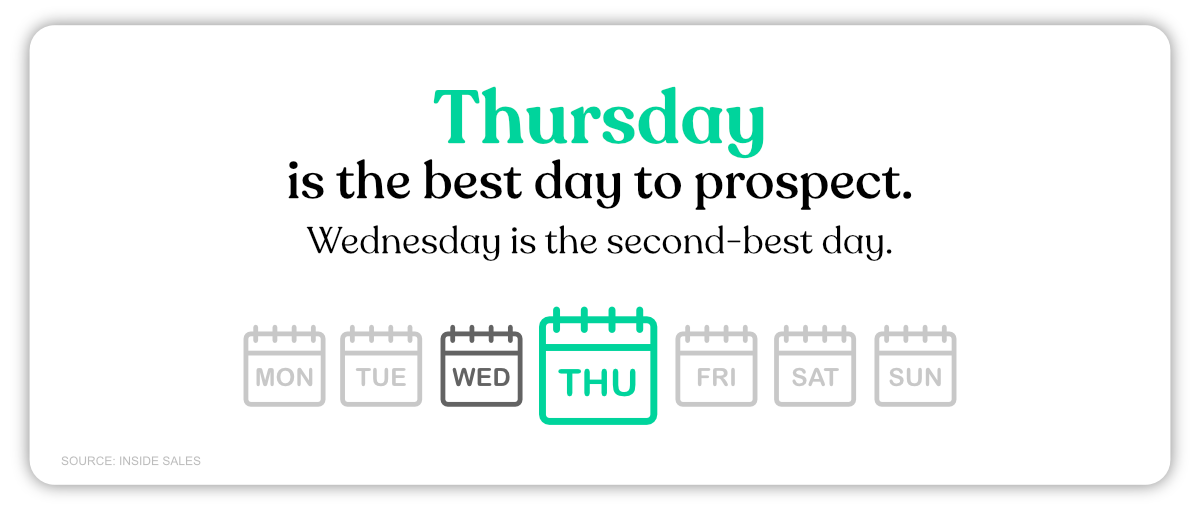
- Thursday is the best day to prospect. Wednesday is the second-best day. (Inside Sales)
- Over 40% of salespeople agree that prospecting is the most challenging sales process. This is followed by closing (36%) and qualifying leads (22%). (HubSpot)
- 34% of prospects are willing to communicate with sellers at industry events. Followed by LinkedIn (21%), text (21%), voicemail (21%), and social media (18%). (HubSpot)
Check out more key statistics:
2. Lead Management Statistics
Lead management isn’t for the faint-hearted. It’s a web of processes that help you acquire, organize, and manage interactions with leads. How you go about handling your leads eventually determines your success rates. As you read some astounding statistics, you’ll realize how critical nurturing leads can be.
- 74% of companies agree that converting leads into customers is a top priority (HubSpot)
- 53% of marketers spend half or more of their budget on lead generation. (BrightTALK)
- Nurtured leads perform exceedingly well compared to non-nurtured leads, resulting in a 20% average increase in sales opportunities. (DemandGen Report)
- 79% of marketing leads don’t convert into sales. Lack of lead nurturing is the top reason for this poor result. (MarketingSherpa)
- Despite this, 65% of B2B marketers haven’’t established lead nurturing. (MarketingSherpa)
- Companies excelling at lead nurturing produce 50% more sales-ready leads at 33% lower cost. (Forrester Research)
- 61% of B2B marketers pass on all their leads to sales teams. However, only 27% of these leads are qualified. (MarketingSherpa)
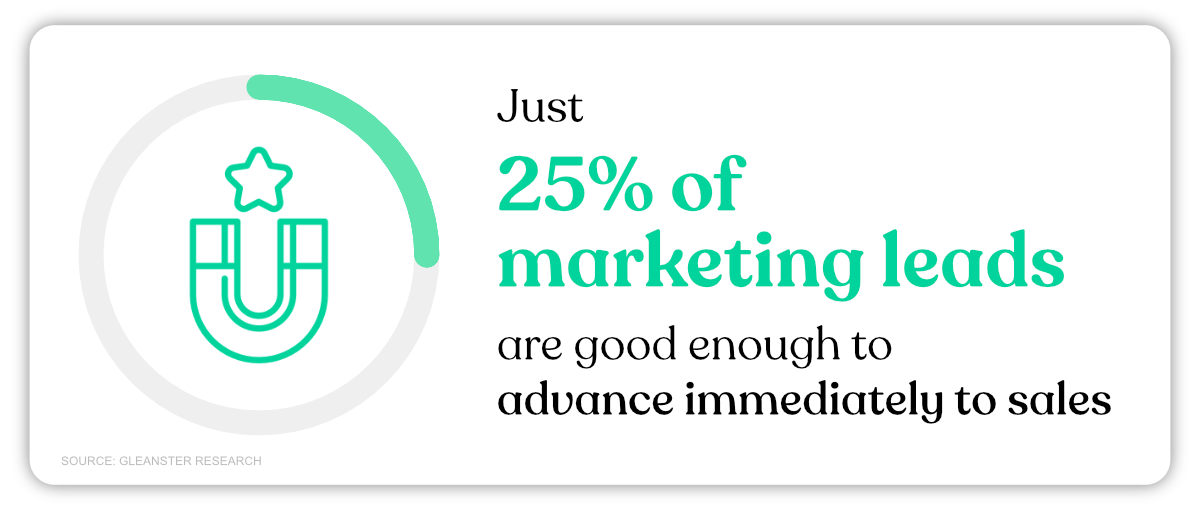
- Just 25% of marketing leads are good enough to advance immediately to sales. (Gleanster Research)
- Only 5% of sales folk say the marketing leads they receive are very high quality. (HubSpot)
- Marketing automation has helped businesses nurture prospects and experience a 451% increase in qualified leads. (Annuitas Group)
- 51% of email marketers think segmenting your email list is the most effective way to personalize lead nurturing. (Ascend2)
- Most larger companies generate less than 5,000 leads per month, with an average of 1,877 per month. (HubSpot)
- Only 44% of companies utilize lead scoring systems. (APSIS)
- Following up with online leads within 5 minutes makes them 9 times more likely to purchase from you. (Spiceworks Ziff Davis)
- Salespeople that respond first win 50% of sales. (InsideSales Lead Response Report)
- You can decrease your odds of a lead qualification by 400% when your response time increases from 5 to 10 minutes. (Harvard Business Review)
3. Sales Follow-Up Statistics
Feel like you’re like following up too many times? Are you overdoing it? If data is anything to go by, you aren’t following up enough! Perseverance pays off, especially in sales. Read on to find out why.
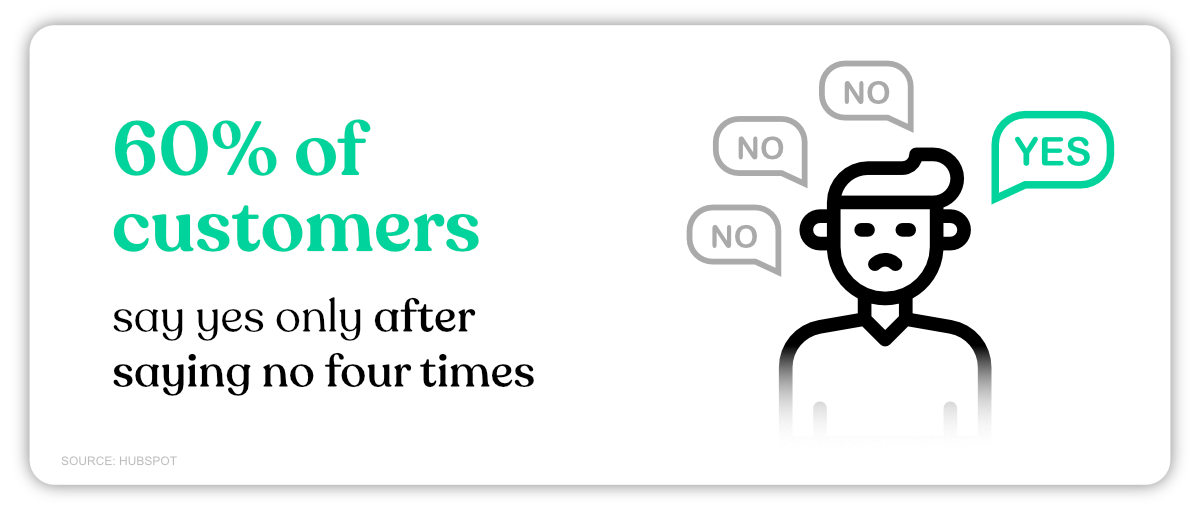
- 60% of customers say yes only after saying no four times. (HubSpot)
- 80% of sales need five follow-up calls. (Brevet)
- In fact, it takes approximately eight follow-up calls just to reach a prospect. (Telenet and Ovation Sales Group)
- Despite that, 44% of sales reps give up after just one follow-up call. (Brevet)
- 64% of sales reps who cross-sell believe email follow-up is the best cross-selling strategy. (HubSpot)
- Merely 2% of sales happen at the first meeting. (MarketingDonut)
- Moreover, 83% of prospects who request product or service information don’t buy for 3 to 12 months. (MarketingDonut)
- Out of 433 companies tested, only 7% responded in the first five minutes after a form submission. Over 50% of the companies didn’t respond for five business days. (Drift)
- An analysis of over 2,200 American companies showed those who attempted to follow up with leads within an hour were 7 times more likely to have meaningful conversations with buyers than those who waited for an hour. (Harvard Business Review)
4. Sales Email Statistics
Sending promotional messages to customers via email may seem old school. However, email marketing is proving to be an effective sales channel. But how effective is it? And with customers receiving hundreds of emails, what can you do to stand out?
- 43% of sales reps claim email is the most effective channel for selling. (HubSpot)
- Email is 40 times better for new customer acquisition than Facebook and Twitter. (Brevet)
- Email marketing has 2 times more return on investment (ROI) than cold calling (HubSpot)
- Just 8.5% of all outreach emails get responses. However, you’ll receive twice the responses if you reach out to the same prospect multiple times. (Backlinko)
- An outreach campaign that contacts multiple prospects multiple times can boost response rates by 160%. (Backlinko)
- 8 out of 10 prospects prefer emails to other communication channels. This includes calls, texts, social media, and in-person. (Rain Group)
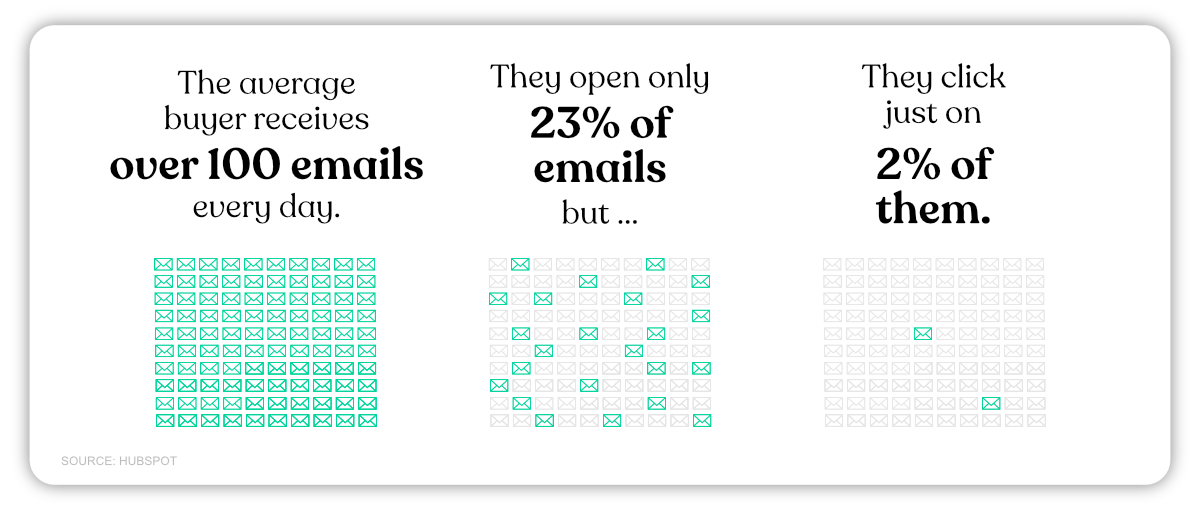
- The average buyer receives over 100 emails every day. But they open only 23% of the emails, and click on just 2% of them. (HubSpot)
- Email marketing features an ROI of 4,400%. So, you make $44 for every dollar spent. (Campaign Monitor)
- Mobile clients account for 41.6% of email opens. (Litmus “The 2021 Email Client Market Share”)
- Additionally, the mobile email open rate was 19.04% in Q4 2020. (Team ITG “email Benchmark” (2021))
- Personalized emails increase click-through rates by 14% and conversion rates by 10%. (Aberdeen Strategy And Research)
- You can boost email open rates by using the words “Sale,” “New,” or “Video” in the subject lines. (Active Trail)
- You can personalize your email subject lines for a 22% increase in email open rate. (Outreach.io)
- Sales reps spend 21% of their day writing emails. (HubSpot)
- 91% of cold emails are viewed the day after they’re sent. (YesWare)
5. Cold Calling Statistics
Wouldn’t it be wonderful if cold calling included guidelines on when to call your leads and how many times to nudge them? While we can’t tell you the best practices, we can certainly provide some insightful statistics.
- 27% of sales professionals claim that making cold calls to new contacts is effective. (Rain Group)
- 41% of sales reps believe that the phone is the most important tool for sales. (Sales Insights Lab)
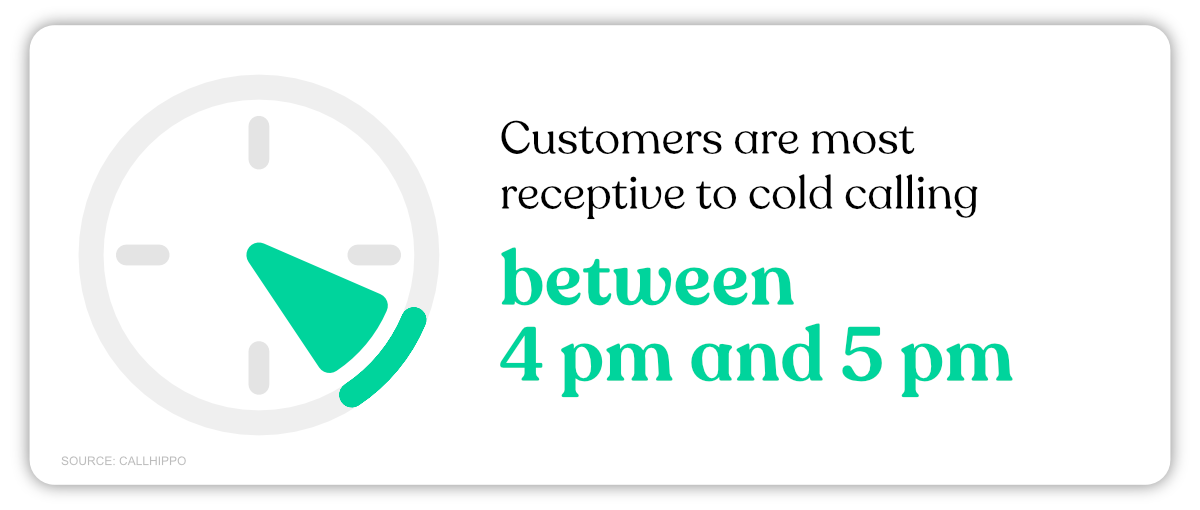
- Customers are most receptive to cold calling between 4 pm and 5 pm. (Callhippo)
- Wednesday is the best day to call your prospects. (Callhippo)
- The second-best time to connect with prospects is between 11 am and 12 pm. (Callhippo)
- The best time to make sales calls is within an hour of receiving their initial inquiry. (Callhippo)
- Mondays and the second half of Fridays are the worst times to call prospects. (Callhippo)
- On average, successful cold calls last 1.36 minutes longer than unsuccessful ones. (Gong.io)
- “Sorry, this is a bad time” isn’t bad news. 42% of buyers would purchase if the sales rep calls back at a pre-set time and date. (Invesp)
- Interestingly, successful sales professionals use the word we 65% more. (Gong.io)
- Similarly, using the word our instead of my is 55% more successful during cold calls. (Gong.io)
- A phrase like “Did I catch you at a bad time?” can contribute to dropping your success rate for booking a meeting by 40%. Whereas, opening with a personal “How have you been?” increases your success rate by 660%. (Gong.io)
- Productive salespeople talk for 54% of each sales call, while less productive sales reps speak for only 42% of conversations. (Gong.io)
- 69% of customers have accepted cold calls from new providers. (Crunchbase)
- 57% of C-level buyers prefer phone calls. (Crunchbase)
- Companies that didn’t cold call experienced 42% less growth than those that did. (Crunchbase)
- If you’re talking to the decision-maker, six is the ideal number of cold calls to win a sale. (Crunchbase)
- The average inside sales rep makes 33 cold calls per day. (ForEntrepreneurs and The Bridge Group)
- The typical inside sales rep has 6.6 conversations per day. (ForEntrepreneurs and The Bridge Group)
- An average sales pro spends 7.5 hours cold-calling to secure one referral or appointment. (Baylor University)
- 90% of CEOs claim never to return cold calls or cold emails. (InsideView)
- The average sales professional produces roughly one meeting appointment or referral for every 209 cold calls. (Baylor University)
- Around 72% of all cold calls don’t even get through to a human being. (Baylor University)
- 1 in 59 cold calls that are answered generates an appointment or referral. (Baylor University)
6. Social Selling Statistics
Social selling is the strategic use of social media platforms to connect and build relationships with potential customers. Want to be on top of your sales game? Get ready for the social selling launchpad.
- 72% of sales reps who use social media for sales outperform their peers. (Jim Keenan Study)
- 78% of social sellers make more sales than their counterparts who aren’t using social media. (LinkedIn’s Social Selling Index)
- Social sellers acquire a larger volume of new customers and achieve better conversion rates than counterparts who don’t use social media. (HubSpot)
- 54% of sales reps track closed customer deals to social media engagement. (Jim Keenan Study)
- 74.9% of companies with social selling tactics grow their sales teams in the next 12 months. (The State of Social Selling Report)
- 90% of top-performing sellers use social media in their sales process. (LinkedIn’s State of Sales Report)
- Over 70% of sales pros use social selling tools like Facebook, LinkedIn, and Twitter. (LinkedIn’s State of Sales Report)
- 50% of sales pros spend 3 to 10 hours weekly using social selling tools. (LinkedIn’s State of Sales Report)
- 84% of C-level executives and 75% of B2B customers use social media to make buying decisions. (Social Buying Meets Social Selling, a white paper report)
- 31% of B2B professionals said that social selling lets them build deeper connections with their clients. (CSO Insights Report)
- 4 in 10 sales reps closed 2 to 5 deals directly thanks to social media. (Jim Keenan Study)
- Social selling tools can increase a deal size by 35%. (HubSpot)
- 56% of sales professionals find new prospects using social media. (HubSpot)
- The majority of Americans use YouTube (73%), Facebook (68%), or some other social media (22%–35%) channel. (Pew Research Center)
- Moreover, 84% of buyers who have access to social media have larger buying budgets than buyers who don’t use social platforms. (Social Buying Meets Social Selling, a white paper report)
- A content preferences survey found that 95% of customers seek credible content from industry thought leaders. (The Demand Gen Report 2019)
- Video dominates. Posts with videos can generate engagement rates of 50% or more. (Databox)
- 96% of consumers want to interact with industry leaders, and often seek it through Twitter. (Databox)
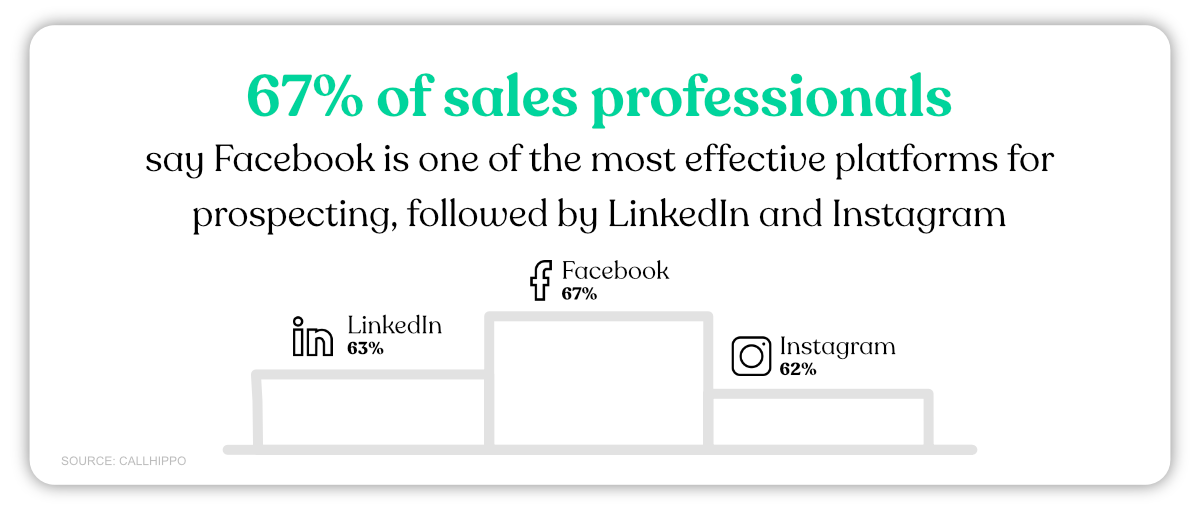
- 67% of sales professionals who use social media for prospecting say Facebook is one of the most effective platforms, followed by LinkedIn (63%) and Instagram (62%). (HubSpot)
Let’s now look at the key sales statistics related to these three major social selling channels.
A. Instagram Sales Statistics
- Instagram’s advertising reach outpaced Facebook in 2021. (Hootsuite)
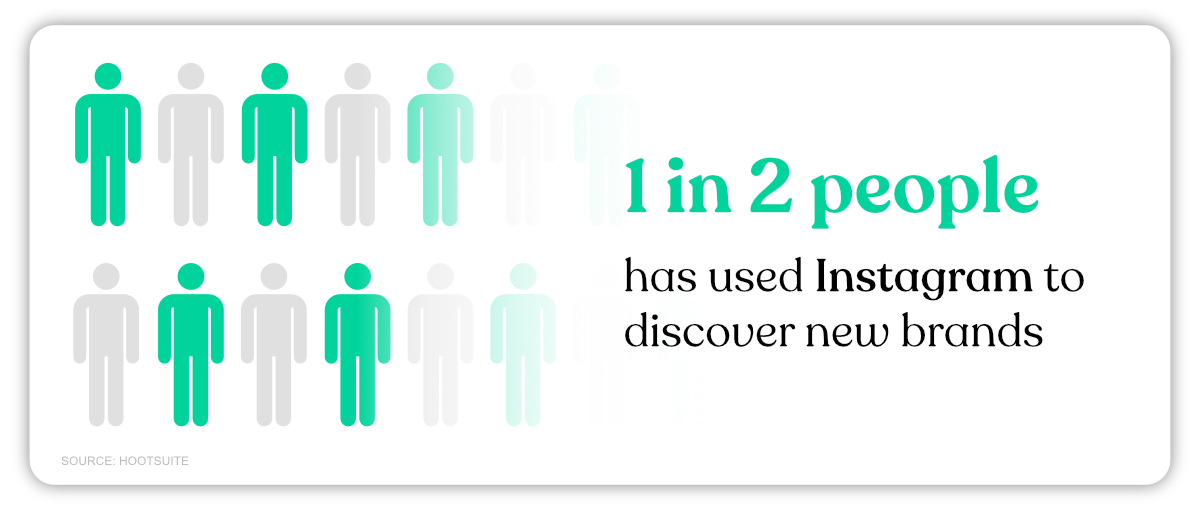
- 1 in 2 people has used Instagram to discover new brands, making it an incredible discovery tool. (Hootsuite)
- 44% of Instagram users use it to shop weekly. (Hootsuite)
B. Facebook Sales Statistics
- Facebook’s potential advertising reach is a whopping 2.11 billion people. (Hootsuite)
- Facebook Marketplace has over 1 billion monthly active users. (Hootsuite)
- 50% of consumers want to discover new products using Facebook Stories. (Hootsuite)
C. LinkedIn Sales Statistics
- 40% of B2B marketers claim LinkedIn is the most effective channel for driving high-quality leads. (LinkedIn)
- Brands witness a 33% increase in purchase intent due to ad exposure on LinkedIn. (LinkedIn)
- Audiences exposed to brand messaging on LinkedIn are 6 times more likely to convert. (LinkedIn)
7. Online And eCommerce Sales Statistics
Everybody is shopping online. But why? Data suggests that it’s because of the price point and not convenience. Read on for more interesting data.
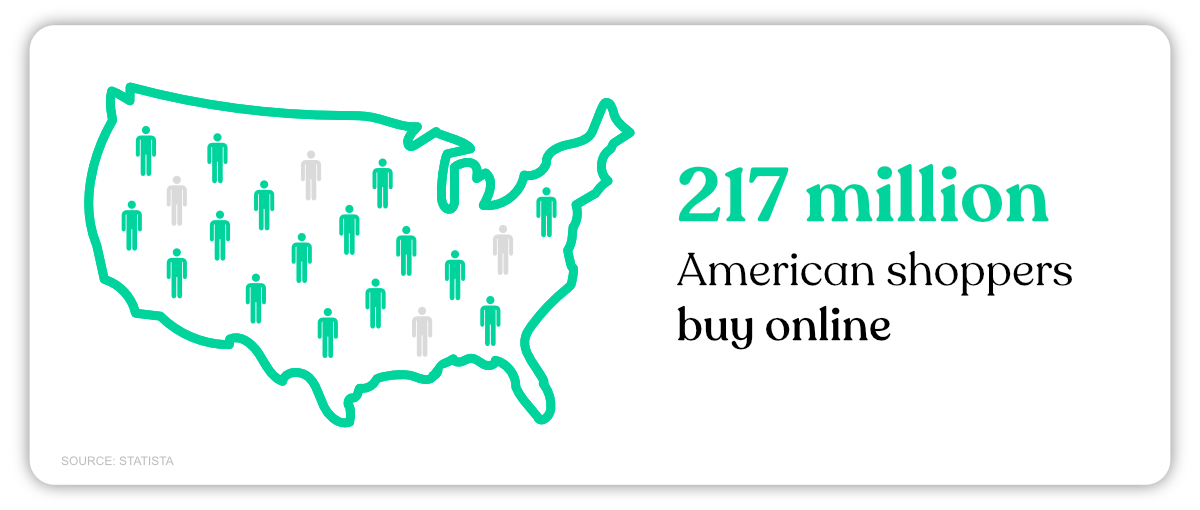
- 217 million American shoppers buy online. (Statista)
- American shoppers indulge in online shopping to find lower costs, not convenience. (Pew Research Center)
- Interestingly, 64% of Americans would rather shop in person than online if the prices match. (Pew Research Center)
- 82% of Americans check online reviews and ratings before buying. (Pew Research Center)
- However, only half of the American shoppers trust these online reviews and ratings. (Pew Research Center)
- Retail eCommerce sales amounted to approximately $5.2 trillion in 2021. This figure will reach about $8.1 trillion by 2026. (Statista)
- Ecommerce sites keep optimizing for mobile. This is because mobile commerce is steadily growing. In 2021, $3.56 Trillion in retail ecommerce sales were made from mobile users. (Statista).
- 58.4% of internet users buy something online weekly. Consumer electronics ($988.4 billion) and fashion ($904.5 billion) show the most spending. (Datereportal).
- Online shopping experiences with PayPal checkouts convert at 88.7%, 82% higher than a checkout without PayPal. (PayPal)
- Customer purchases increase by 45% when forced registration isn’t imposed on the checkout page. (UIE)
- Orders with free shipping average around 30% higher order value. (Invesp)
8. Digital Marketing Stats
Do your digital marketing efforts need to sync with your sales goals? Find out what the industry is doing.
- 63% of businesses increased their digital marketing budgets in 2021. (HubSpot)
- 87% of sales and marketing leaders think a collaboration between marketing and sales enables critical business growth. (LinkedIn)
- 81% of marketers share metrics and goals with sales colleagues. (Salesforce)
9. Sales Productivity Statistics
It’s simple. Improving sales productivity will result in better sales figures. But what aspects of your sales process needs rework? That can be a time-consuming thing to figure out. Don’t worry. We’ve compiled key statistics that will tell you what companies, sales leaders, and executives think can be done better.
- Conversational selling, where sales reps chat with leads, instead of pitching, appears to be a successful tactic. Only 7% of top-performing sales reps report pitching their offering. On the other hand, 19% of non-top performers pitch their offerings. (Sales Insights Lab)
- 81.6% of top sales reps spend 4 hours or more daily on sales activities. (Sales Insights Lab)
- Just 24.3% of salespeople exceeded their sales quota in 2021. This may be because sales reps need to get in front of more people. (Sales Insights Lab)
- 66.7% of salespeople admitted they made contact with 250 or fewer prospects in 2021. Meanwhile, only 15% contacted over 1,000 prospects in the same year. (Sales Insights Lab)
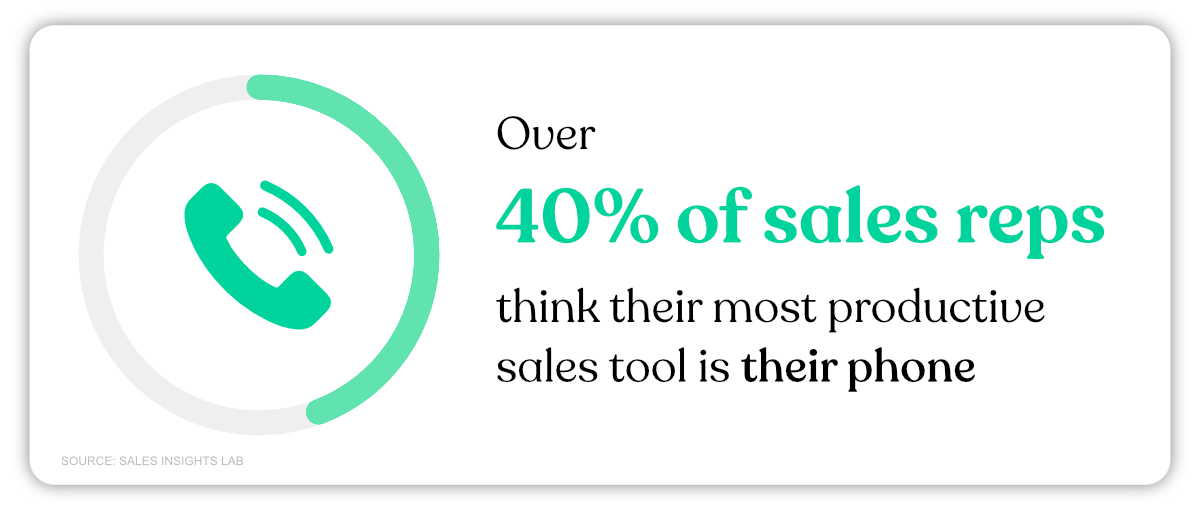
- Over 40% of sales reps think their most productive sales tool is their phone. (Sales Insights Lab)
- 54% of sales leaders think calls made is one of the most important productivity metrics to track. (HubSpot)
- 54% of sales leaders say number of follow-ups is one of the most important productivity metrics to track. (HubSpot)
- High-performing sales teams use nearly 3 times the amount of sales technology than underperforming teams. (DocuSign)
- 79% of sales executives agree that a leading driver of hitting new targets is improving the productivity of existing salespeople. (Salesforce)
- 81% of companies think productivity would improve with better processes, skills, or competency training. (DocuSign)
- 84% of sales executives think content search and utilization is a top productivity improvement area. (Salesforce)
- A typical company spends over 24K per person on improving productivity, yet 49% of organizations need more means to measure productivity. (Salesforce)
10. Referral Sales Statistics
Referral selling involves asking current customers to refer your product or service to another customer. Sounds easy, right? You’d be surprised to see how many sales reps don’t bother asking their customers for referrals.
- 91% of customers say they don’t mind giving referrals. However, only 11% of salespeople ask for referrals. (Wharton School of Business)
- Only 29% of happy buyers give referrals because salespeople don’t ask. (Texas Tech)
- The average lifetime value of referred customers is 16% higher than that of non-referred customers. (Wharton School of Business)
- 61% of buyers have recommended local businesses to acquaintances. (BrightLocal)
- Referrals end up creating 65% of new business opportunities. (Wharton School of Business)
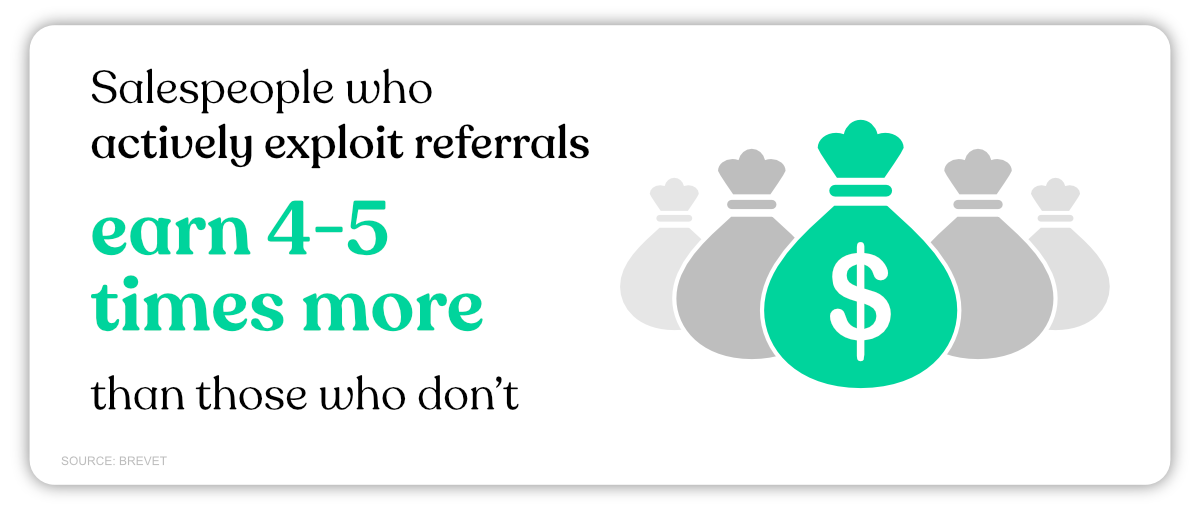
- Salespeople who actively exploit referrals earn 4 to 5 times more than those who don’t. (Brevet)
- 84% of buyers kick off their buying process using a referral. (Harvard Business Review)
- Referrals are an effective form of advertising. Over 84% of consumers trust recommendations from people they know. (Nielsen)
- People of all age groups trust peer recommendations more than other sources. (Deloitte)
- However, millennials are 3 times more likely than baby boomers to seek advice from social channels before purchasing. (Kelton Research)
- The top two sources for buyer advice are peers and industry experts. (Demand Gen)
- As a result, word of mouth creates over $6 trillion in consumer spending every year. (CMO)
11. Sales Career Statistics
Curious about what a sales rep’s career looks like today? Read on for some tidbits.
- As of 2021, 28% of B2B organizations have hybrid sales roles (McKinsey B2B Pulse Survey 2021)
- The typical sales account executive spends 2.7 years on the job and takes 4.7 months to ramp. (Bridge Group Inc)
- A 6% employment growth is expected for sales representatives by 2026. (Bureau of Labor Statistics)
12. Sales Coaching Statistics
A well-trained sales team will outsell your competitors and create lasting success. But data suggests that companies need to prioritize sales training. And most sales reps appear to lack essential skills.
- 55% of the people working in sales don’t have the right skills to be successful. (Capiler Corp)
- The average organization spends $10K to $15K hiring individuals and only $2K annually on training. (Bridge Group Inc)
- It takes a new sales rep over ten months to be fully productive. (Brainshark)
- 58% of customers claim sales reps cannot answer their questions effectively. (Blender)
- 84% of all sales training is lost within 90 days. This is because of the need for more information retention among sales personnel. (Blender)
- 82% of B2B sales decision-makers think sales reps are unprepared. (Blender)
- Continuous training results in 50% higher net sales per employee. (Brevet)
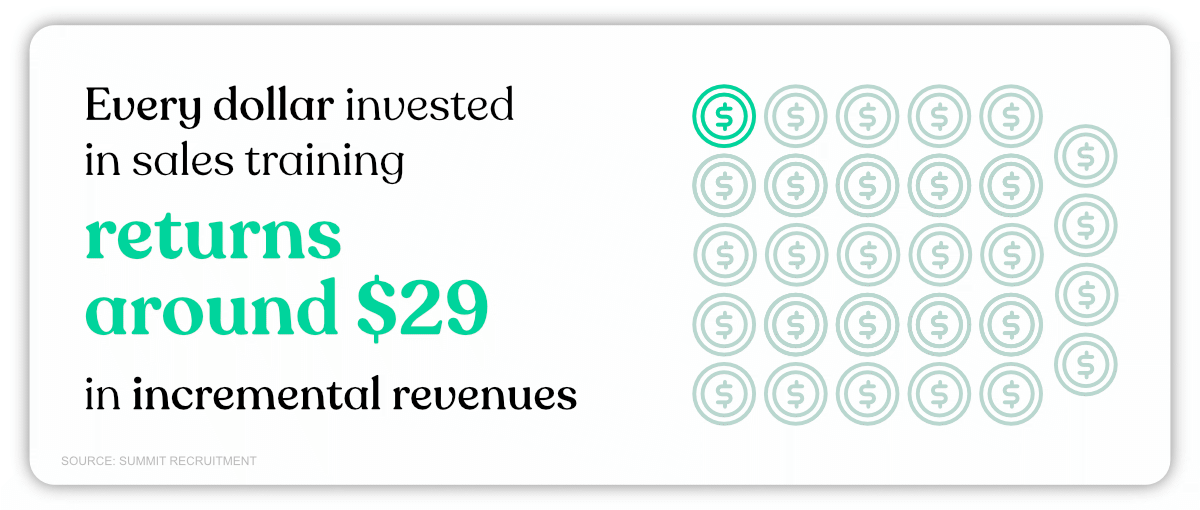
- Every dollar invested in sales training returns around $29 in incremental revenues. (Summit Recruitment)
- The best sales training will improve individual performance by 20%. (Salesforce)
- American companies spend approximately $20 billion yearly on sales training. (ATD Research)
- When salespeople use the company’s methodology and get consistent coaching, companies see 73% quota attainment. (ATD Research)
- 65% of employees agree that learning opportunities and the quality of training positively influence their engagement. (ATD Research)
- High-performing sales teams are twice more likely to provide ongoing training than low-performing ones. (ATD Research)
13. Inside Sales Statistics
Inside sales happen over calls, texts, emails, and cloud-based applications. Is it effective? How much does it cost? Read through these statistics to find out.
- The average inside sales call costs $50. This is significantly lesser than outside sales calls that cost around $308. (Pointclear)
- Inside sales average dials are down 20% year-over-year. (Bridge Group Inc)
- 37% of high-growth companies still use inside sales as a primary strategy. This is followed by field sales (27%), internet sales (23%), and channel sales (8%). (Pacific Crest)
- Only 33% of inside sales rep time is spent actively selling. (CSO Insights Report)
- Sales professionals spend over 40% of their time looking for somebody to call. (Inside Sales)
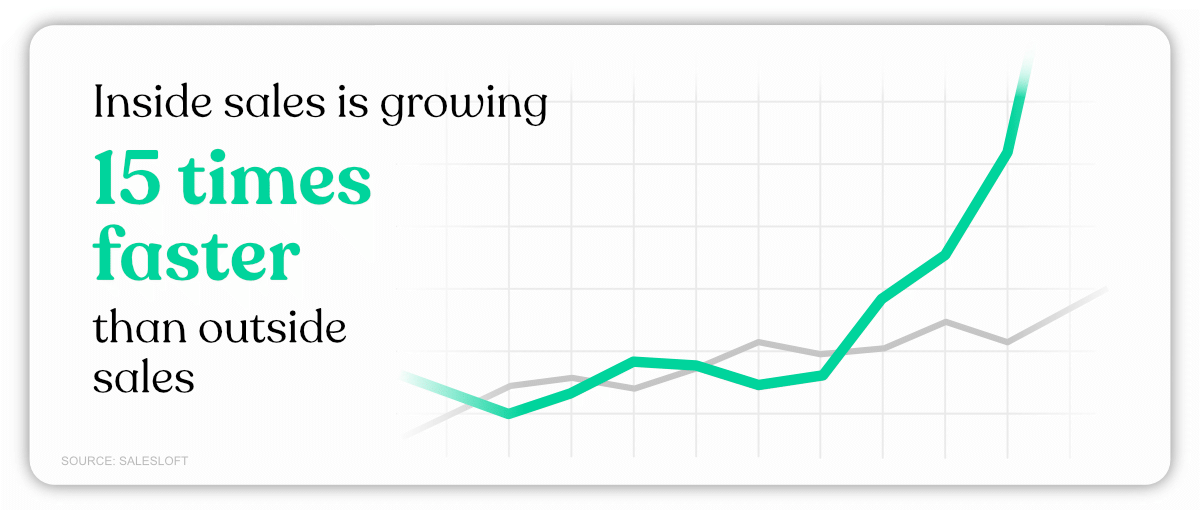
- Inside sales is growing 15 times faster than outside sales. (SalesLoft)
- For every outside sales rep that gets hired, ten inside sales reps get hired. (SalesLoft)
- 46% of fast-growing tech organizations use inside sales. Only 21% turn to outside sales. (Harvard Business Review)
14. Outside Sales Statistics
Outside sales is all about face-to-face interactions. We bet you’re wondering: Is inside sales better than outside sales? Find out what the data says.
- Outside sales professionals spend 89% more time selling remotely than in 2013. (Business Wire)
- 70% of Americans still want to try out products in person. (Pew Research Center)
- In fact, 86% of buyers want to be able to ask in-person questions before buying. (Pew Research Center)
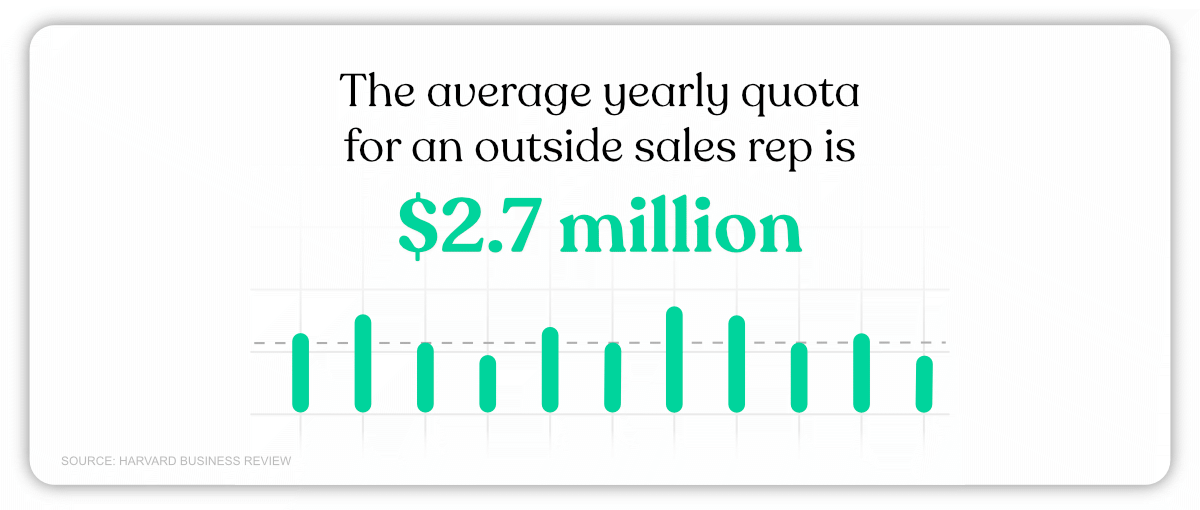
- The average yearly quota for an outside sales rep is $2.7 million. (Harvard Business Review)
- Direct selling has grown from 1% to 6% each year since 2010, and is now a $34.4 billion industry. (Direct Selling Association)
- 50% of customers harbor a “neutral” feeling toward direct sales reps, while 31% approve of them. Only 20% of buyers express dislike towards direct sales reps. (Direct Selling Association)
15. Sales CRM Statistics
From organizing contacts to automating key tasks, CRM (Customer Relationship Management) tools take care of all the housekeeping tasks you don’t have time for. But do they contribute towards your sales team’s efficiency? Let’s find out.
- CRMs are the most popular sales tools. They’re followed by social prospecting, data services, email, phone, and sales cadence. (SalesforLife)
- 57% of sales reps spend 3 to 10 hours per week using CRM tools. (LinkedIn)
- CRM tools can boost sales by 29% and sales rep productivity by 34%. (Salesforce)
- 24% more sales reps meet their annual quotas when given mobile access to CRM tools. (Aberdeen Group)
- 22% of sales leaders say leveraging CRM tools to the fullest potential is one of their top goals in 2022. (HubSpot)
- 32% of sales professionals who use a CRM think “helping you keep track of your leads” is one of its biggest benefits. (HubSpot)
- 24% of sales reps think “improving customer retention” is a CRM’s biggest benefit. (HubSpot)
- 91% of businesses with more than 11 employees use CRM tools. (Buyerzone)
- An adequately integrated CRM can provide a 245% ROI. (Forrester)
- 76% of companies saw an increase in sales between 6% and 20% after implementing sales enablement initiatives. (Salesforce)
- Sales reps spend anywhere from 3 to 11 hours per week seeking answers about tools, processes, or information. (Spekit)
16. Sales Closing Stats
Who doesn’t want to be the best closer the city has ever seen? Harvey Spector’s advice aside, here are some important statistics that outline realistic closing rates you should target.
- Inside sales reps have a success rate of 18% with pitches. (IHireSalesPeople)
- Outside sales pros have a higher closing rate of 40%. (IHireSalesPeople)
- The average closing rate across all industries is 19%. (HubSpot)
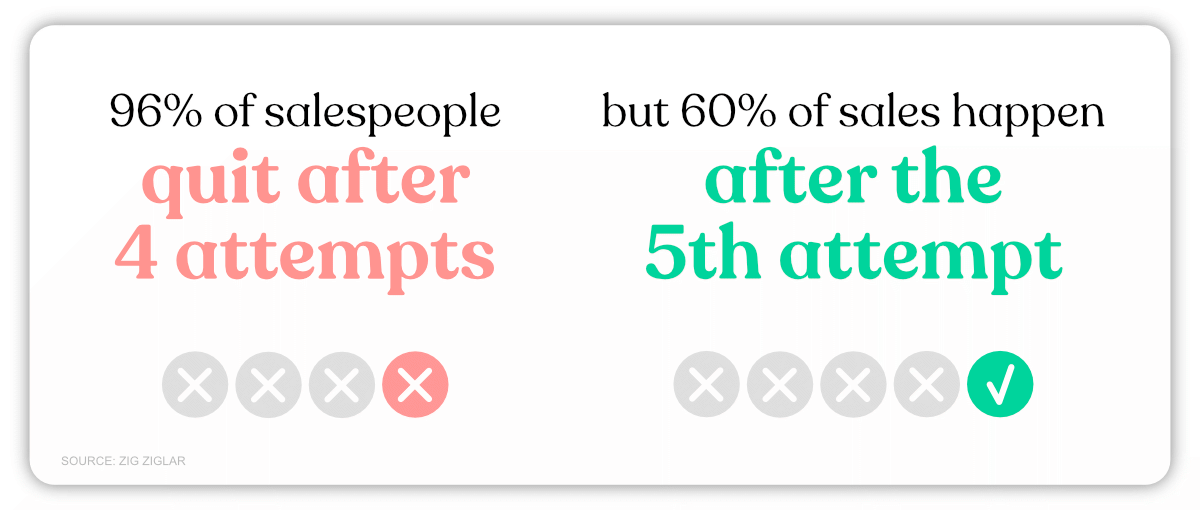
- 96% of salespeople quit after four attempts, but 60% of sales happen after the 5th attempt. (Zig Ziglar)
17. Inbound And Outbound Sales Statistics
Inbound sales happen when potential customers reach out to your business. Outbound sales happen when sales reps reach out to prospects. Find out which of these two scenarios is more beneficial.
- When quizzed about which marketing tactic provides higher quality sales leads, 59% of marketers said inbound, and 16% said outbound. (HubSpot)
- Inbound marketing costs $14 less than traditional marketing for every newly acquired buyer. (Invesp)
- Inbound leads acquired after five months of consistent inbound marketing outreach are 80% less expensive than outbound leads. (Invesp)
18. Door-to-Door Sales Statistics
Why are we still talking about door-to-door sales? Probably because it still generates nearly $30 billion a year in sales. But that doesn’t make this strategy any easier to execute.
- A sales rep can create approximately one lead for every 50 door knocks. (realestatecareermentor)
- About 2% of the sales rep’s door-to-door knocks generate a sale. (leadheroes)
- A door-to-door sales rep needs a 30% to 40% contact rate to be successful. (Spotio)
- 25% of all contacts usually listen to a sales rep’s pitch. (leadheroes)
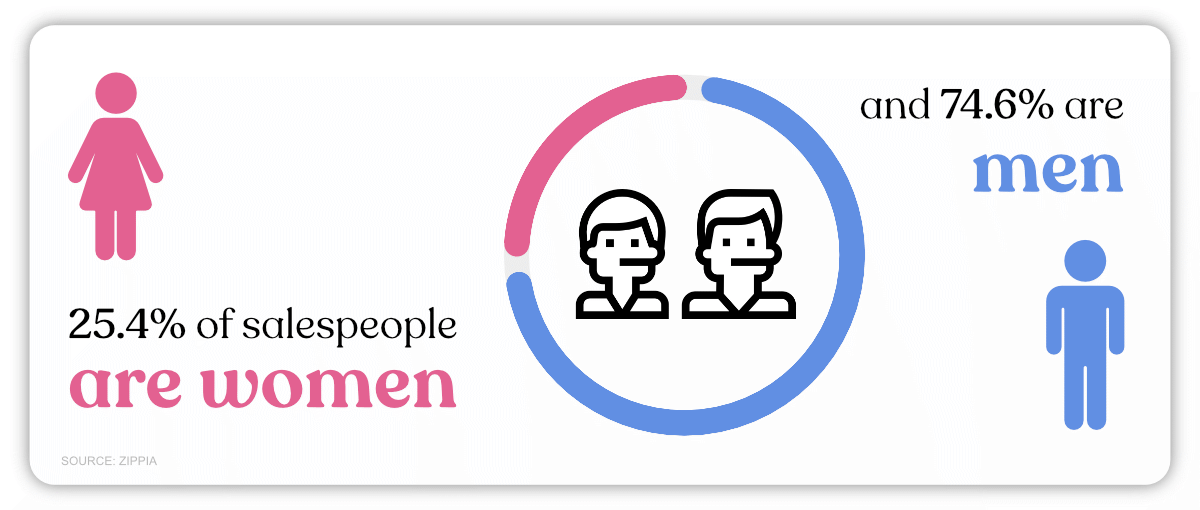
- 25.4% of door-to-door salespeople are women, and 74.6% are men. (Zippia)
- Door hangers left by sales reps generate one call back for every 200 hangers. (leadheroes)
19. Sales Conversion Rate Statistics
Quickly compare how your sales conversion rate measures up to everybody else.
- The average conversion rate across all industries is 2.5%. (Databox)
- The average conversion rate in the retail industry is 2.63%. (Tech Jury)
- The finance industry has the highest conversion rate, with an industry average of 5.01%. (Tech Jury)
- The average landing page conversion rate remains the highest at 24%. (HubSpot)
- The highest-converting companies spend at least 5% of their budget on conversion rate optimization. (Startup Bonsai)

20. Sales Challenges Statistics
Here’s a breakdown of the biggest challenges faced by sales reps and leaders.
- 31% of small businesses claim that competing with low-cost providers is their biggest selling challenge. (Richardson)
- Only 46% of sales representatives report having sufficient data insights about buyer intent. (SalesForce)
- 81% of marketing and sales teams don’t take the time to review and correct their sales processes. (Data Dwell)
- 1 in 5 sales reps believes they don’t have the correct resources to keep their sales processes on track. (Data Dwell)
21. Brand-Related Sales Statistics
What do the sales of some of the biggest brands in the world look like? Here’s some information on Amazon, Apple, and Nike.
A. Amazon Product Sales Statistics
- 85% of sellers spend approximately $2,500 or less on advertising for their Amazon business. 32% plan to increase this spending in 2022. (Jungle Scout)
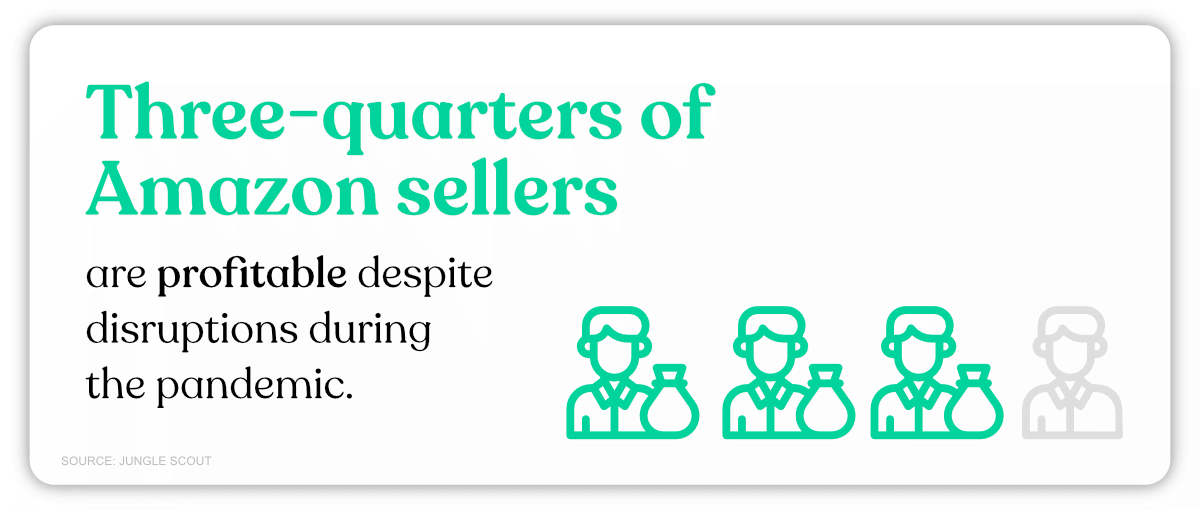
- Three-quarters of Amazon sellers are profitable in 2022, despite serious supply chain disruptions during the pandemic. (Jungle Scout)
B. Apple Sales Statistics
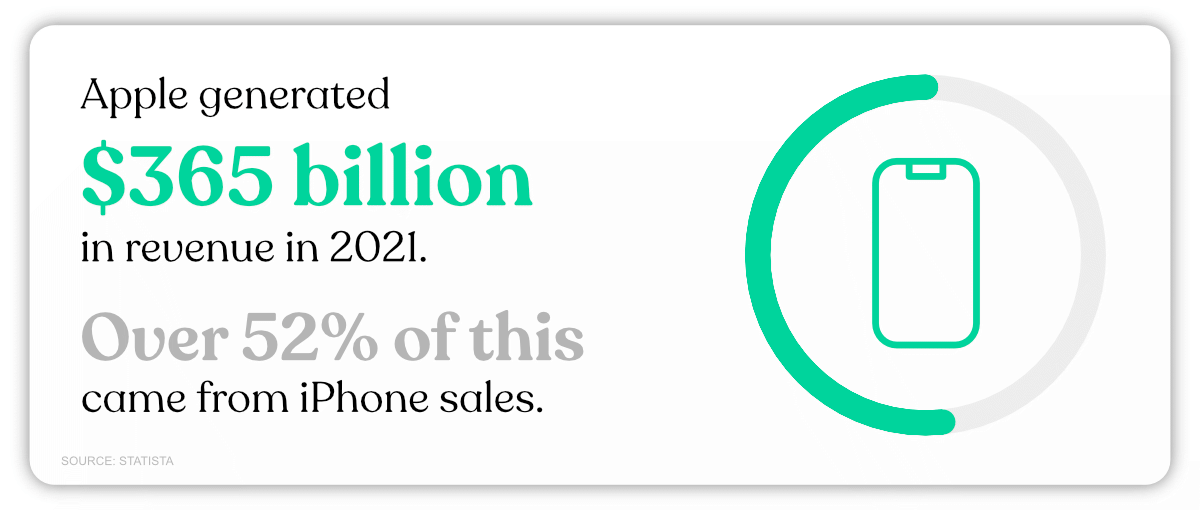
- Apple generated $365 billion in revenue in 2021. Over 52% of this came from iPhone sales. (Statista)
- Apple Services was the second-largest revenue-generating division, at 18%. (Statista)
- 230 million iPhones, 71 million iPads, and 20 million MacBooks were sold in 2020 (Apple Insider)
- Apple’s home and wearables division grew 25% in 2021. (Apple Insider)
C. Nike Sales Statistics
- Nike’s global revenue amounted to about $46.71 billion in 2022. This is an increase of over two billion compared to the previous financial year. (Statista)
- A European survey showed the overwhelming majority (around 95.5%) of outdoor goods, and online sports shoppers in the United Kingdom and Germany recognized the Nike brand. (Statista)
- Nike spent $3.85 billion on advertising in 2022, an increase from $3.114 billion in fiscal 2021. (Wall Street Zen)
22. US Retail Sales Statistics
Retail sales are a great macroeconomic metric that tracks consumer demand for finished goods. Find out what the retail scene looks like in the US and where it’s headed.
- Retail establishments include grocery stores, bookstores, restaurants, and more. There are over four million retail establishments in the US. (Statista)
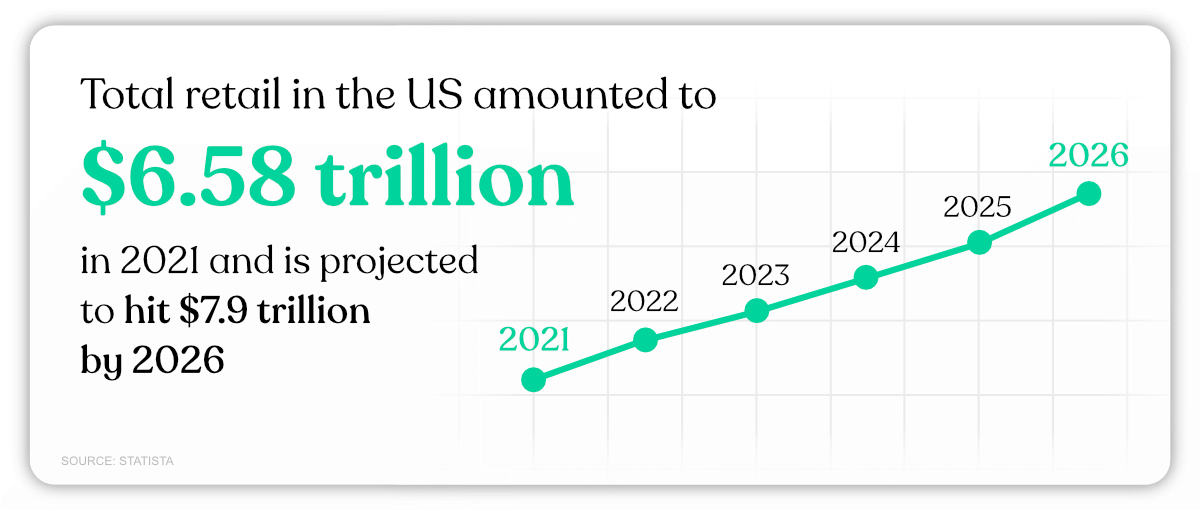
- Total retail sales in the US amounted to $6.58 trillion in 2021. (Statista)
- US retail sales are projected to hit $7.9 trillion by 2026. (Statista)
- Retail sales saw a significant dip during the pandemic. Total retail sales in the first quarter of 2020 fell by 1.6% and 4.2% in the second quarter. (Oberlo)
- Categories like groceries saw a 17% spike in sales in February 2021. Whereas, jewelry and accessories saw a dip of -35%. (Statista)
23. Home Sales Statistics
Despite the pandemic, the American real estate market seems to be recovering steadily. Here are some statistics to keep in mind.
- The median sales price of new houses sold in September 2022 was $470,600. The average sales price was $517,700. (United States Census Bureau)
- In 2021, home sales in the US saw over 6.1 million housing transactions, reaching the highest value since 2006. (Statista)
- 92% of US homes sold in 2021 were sold using a broker or an agent. (The Close)
- US homes spent a median of 14 days on the market in June 2022. (The Close)
24. App Sales Statistics
The global mobile app market has been booming for a while now. But where is this industry making its money?
- The mobile apps market is expected to generate a revenue of over $935 billion by 2023. (Statista)
- The Apple App Store currently has over 1.96 million apps for download. (Statista)
- Google Play Store has over 2.87 million apps available for download. (Statista)
- 49% of mobile app users open an app 11+ times daily. And 21% of Millennials open an app over 50 times each day. (The Manifest)
- In-app purchase (IAP) revenue is projected to reach $204.9 billion by the end of 2022. (Statista)
- Paid app revenue is projected to reach $5.25 billion by the end of 2022. (Statista)
- Global consumer spending on apps reached $170 billion in 2021, an 18.88% jump from 2022. (Statista)
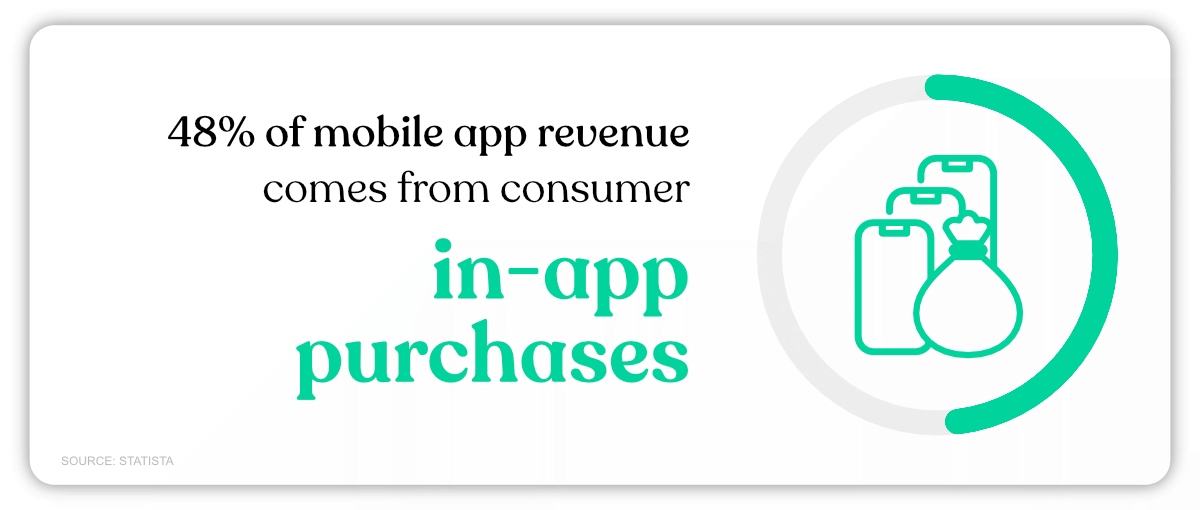
- 48% of mobile app revenue comes from consumer in-app purchases. (Statista)
If you’re interested in money-making apps, check out our top side-hustle apps.
25. Sales Trivia
We want to conclude this monster list with some fun, ‘nice to know’ statistics about sales. These would be great to kick off a sales presentation with. Maybe use them to wake up a tired audience? We’ll leave that to you.
- A business loses 10% and 30% of its customers annually. (Brevet)
- 63% of all sales conversations end with the sales rep NOT asking for the sale. (Zig Ziglar)
- 55% of the people working in sales should be doing something else. (Caliper Corp)
- More than 50% of sales managers are too busy to develop and train their sales teams. (Salesforce)
- 93% of consumers consider visual appearance to be the key factor in purchasing something. (Justuno)
- Introverts’ personalities do just as well in sales jobs as extroverts. (Furnham & Fudge)
- 80% of all sales are generated by 20% of salespeople. This is because the winners sell to the prospects the losers give up on. (Bill Corbin on LinkedIn)
Wrapping Up
The sales landscape is ever-evolving. And you’ll want to stay up to date on the latest trends to succeed. This massive list of 250+ sales statistics should help you make effective changes to your sales strategy, boost your numbers, and evaluate your team’s performance.


