

Soon Zerodha Mutual Fund will launch two schemes where the benchmark is the Nifty LargeMidcap 250 Index. Do you actually need this index in your portfolio?
As of now, there is only one index fund that replicates this index (Edelweiss Nifty LargeMidCap 250 Index Fund). As Index Funds are gaining popularity among investors and only one fund is currently available for this index, investors are now eager to look for Zerodha Mutual Fund company’s offerings of the two funds.
What is the NIFTY LargeMidcap 250 Index?
The NIFTY LargeMidcap 250 reflects the performance of a portfolio of 100 large-cap and 150 mid-cap companies listed on the NSE, represented through the NIFTY 100 and the NIFTY Midcap 150 index respectively. The aggregate weight of large-cap stocks and mid-cap stocks is 50% each and is reset on a quarterly basis.
Highlights
- The index has a base date of April 01, 2005, and a base value of 1000.
- The index consists of all Stocks forming part of the NIFTY 100 and NIFTY Midcap 150 index.
- The aggregate weight of large-cap stocks and Midcap stocks are capped at 50% each.
- The index shall be reconstituted on a semi-annual basis along with the NIFTY 100 and NIFTY Midcap 150 index.
- Weights of large-cap and mid-cap stocks are rebalanced on a quarterly basis.
The top holdings based on weightage as of now are as below.
| Company’s Name | Weight(%) |
| HDFC Bank Ltd. | 5.64 |
| Reliance Industries Ltd. | 3.92 |
| ICICI Bank Ltd. | 3.23 |
| Infosys Ltd. | 2.47 |
| ITC Ltd. | 1.87 |
| Tata Consultancy Services Ltd. | 1.65 |
| Larsen & Toubro Ltd. | 1.57 |
| Axis Bank Ltd. | 1.28 |
| Kotak Mahindra Bank Ltd. | 1.24 |
| Shriram Finance Ltd. | 1.22 |
The top 5 sectors in this index are as below.
| Sector | Weight(%) |
| Financial Services | 28.35 |
| Information Technology | 8.67 |
| Capital Goods | 7.8 |
| Healthcare | 7.76 |
| Automobile and Auto Components | 7.4 |
In total these five sectors constitute around 60% of the index. This is a brief knowledge about the NIFTY LargeMidcap 250 Index.
NIFTY LargeMidcap 250 Index – Should you invest?
Do you as an investor need this NIFTY LargeMidcap 250 Index fund in your portfolio? What the history this index actually shows us. Let us try to find it out.
For my comparison purpose, I have selected the Nifty 100 TRI Index, Nifty Midcap 150 TRI Index, and NIFTY LargeMidcap 250 Index. As the NIFTY LargeMidcap 250 Index started on 1st April 2005, I have considered the same date for all three indexes for comparison. Hence, it is almost around 18 years of data with around 4,500 daily data points for our research.
How do all three indexes look plainly?
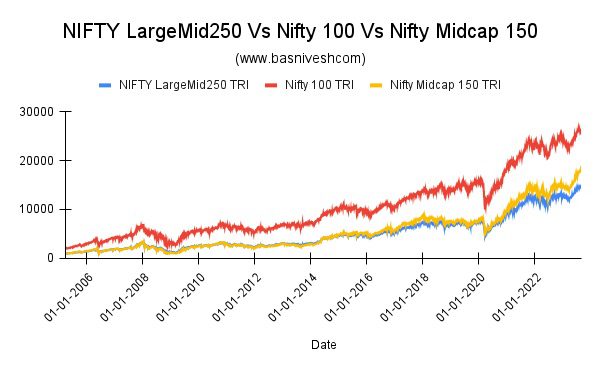
This will not give us a clear picture mainly because Nifty 100 TRI started long back and on 1st April 2005, the value was 2,158. However, for both the NIFTY LargeMidcap 250 Index and Nifty Midcap 150 it was 1,000. Hence, obviously, Nifty 100 TRI looks best performing. But it is a half-truth.
Instead, let us try to understand with an example of what if someone invested Rs.1,00,000 in these three indexes on 1st April 2005 and what are the final value as of now.
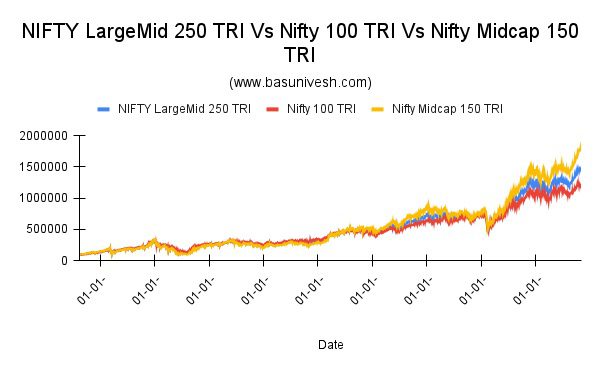
The final values are Rs.14,99,193, Rs.12,11,806, and Rs.18,75,746 for the NIFTY LargeMid 250 TRI, Nifty 100 TRI, and Nifty Midcap 150 TRI indexes respectively. Obviously, this leads to the conclusion that Nifty Midcap 150 TRI performed better and we must blindly jump into investing in this index. Again this is a half-truth. It will not give us the complete picture. Instead, let us look into the drawdown of this journey.
The drawdown is one way to measure risk. This shows how much investment has fallen from its peak and for how long it continued.
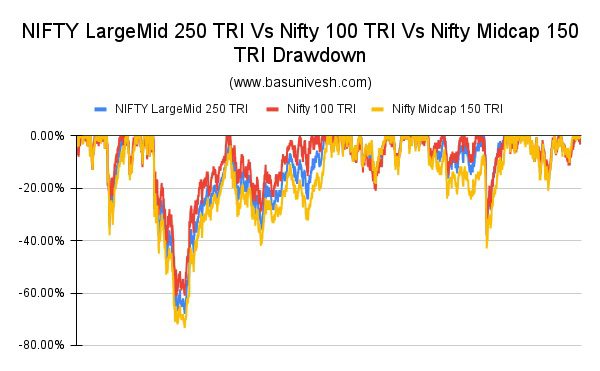
Here it is!! You noticed that the Nifty Midcap 150 TRI drawdown was almost more than 70%. It means the value of what you invested went down by almost 70%. Hence, assuming the Nifty Midcap 150 TRI is best by looking at point-to-point returns of around the last 18 years is not the right way. Instead, we have to look for the risk in investing.
Clearly, the above drawdown image shows that NIFTY LargeMid 250 TRI and Nifty 100 TRI are safer than Nifty Midcap 150 TRI. However, due to midcap exposure in NIFTY LargeMid 250 TRI, it looks more risky than Nifty 100 TRI.
Now let us move on and try to understand the volatility and try to understand whether it is really worth investing in NIFTY LargeMid 250 TRI by looking at rolling returns.
1-Year Rolling Returns of NIFTY LargeMid 250 TRI, Nifty 100 TRI, and Nifty Midcap 150 TRI
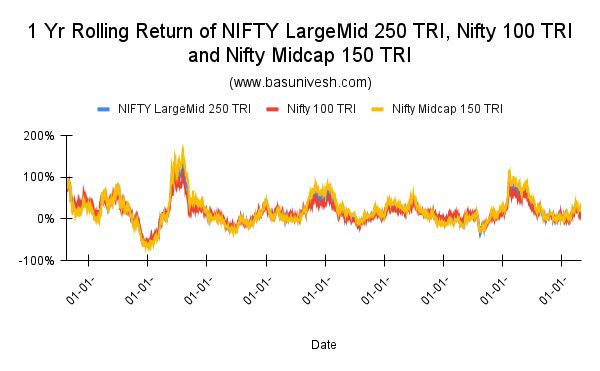
Looks similar with no such deviation in returns. However, if you look into the data, the maximum return is 138%, the minimum is -62% and the average is 18% for NIFTY LargeMid 250 TRI.
Similarly, the maximum return is 112%, the minimum is -57%, and the average is 16% for Nifty 100 TRI.
The maximum is 169%, the minimum is -67%, and the average is 20% for Nifty Midcap 150 TRI.
You noticed that by having exposure of 50% of the midcap index in NIFTY LargeMid 250 TRI, you are increasing the risk to a portfolio with no such greater advantage as the average returns between the two indexes NIFTY LargeMid 250 TRI and Nifty 100 TRI is just around 2% for one year rolling returns.
However, 1-year rolling returns obviously not a better data to judge.
3-Years Rolling Returns of NIFTY LargeMid 250 TRI, Nifty 100 TRI, and Nifty Midcap 150 TRI

You noticed that the Nifty Midcap 150 TRI shows high returns with high risk compared to the NIFTY LargeMid 250 TRI and Nifty 100 TRI.
However, if you look into the data, the maximum return is 38%, the minimum is -12% and the average is 13% for NIFTY LargeMid 250 TRI.
Similarly, the maximum return is 41%, the minimum is -7%, and the average is 12% for Nifty 100 TRI.
The maximum is 41%, the minimum is -17%, and the average is 15% for Nifty Midcap 150 TRI.
This proves that for 3 years of rolling returns, investing in NIFTY LargeMid 250 TRI is not worth compared to even Nifty 100 TRI!!
5-Years Rolling Returns of NIFTY LargeMid 250 TRI, Nifty 100 TRI, and Nifty Midcap 150 TRI
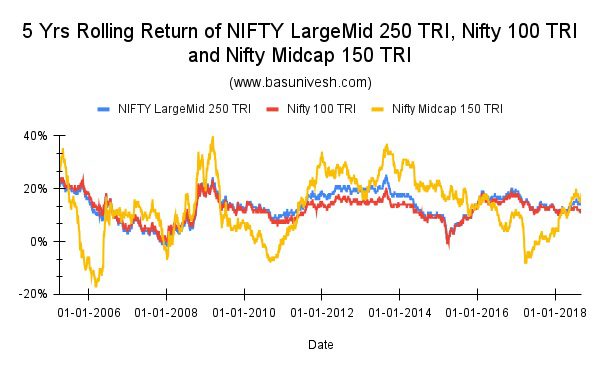
The results of the 5-year rolling return of NIFTY LargeMid 250 TRI, Nifty 100 TRI, and Nifty Midcap 150 TRI are similar to 3-year rolling returns.
The maximum return is 25%, the minimum return is -2%, and the average is 13% for NIFTY LargeMid 250 TRI.
The maximum return is 24%, the minimum return is -1%, and the average is 12% for NIFTY 100 TRI.
The maximum return is 40%, the minimum return is -17%, and the average is 13% for NIFTY Midcap 150 TRI.
This again shows that by adding around 50% to your portfolio through NIFTY LargeMid 250 TRI, there is no great advantage compared to Nifty 100 TRI investors. You are simply increasing the risk with no such great reward.
10-Years Rolling Returns of NIFTY LargeMid 250 TRI, Nifty 100 TRI, and Nifty Midcap 150 TRI
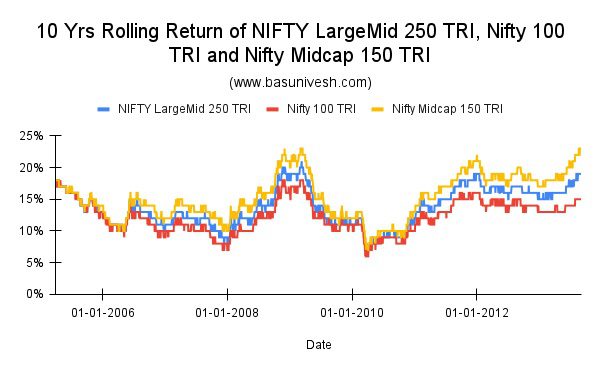
The results are the same even in the case of 10 years of rolling returns.
The maximum return is 21%, the minimum return is 6%, and the average is 14% for NIFTY LargeMid 250 TRI.
The maximum return is 18%, the minimum return is 6%, and the average is 12% for NIFTY 100 TRI.
The maximum return is 23%, the minimum return is 7%, and the average is 15% for NIFTY Midcap 150 TRI.
Conclusion – By looking at the above data, you can conclude that by investing in the Nifty LargeMid 250 index, you are not getting any greater advantage over the Nifty 100. Instead, by adding the Nifty LargeMid 250 index, you are taking a high risk of investing 50% in the Nifty Midcap 150 Index.
Nifty 100 is enough for you to add Nifty LargeMid 250 to your portfolio. One more thing I wish to bring to your notice is that in Nifty 100, the major portion is Nifty 50 compared to Nifty Next 50. Hence, if you divide this Nifty 100 between Nifty 50 and Nifty Next 50 with various combinations, then in my view, you will reduce the risk and can have better risk-adjusted returns than adding Nifty LargeMid 250. Do remember that Nifty Next 50 acts like a typical Nifty Midcap. I wrote a post on this long back and you can refer to the same (as this is the old post, you have to make sure the comparison as per today’s value) “Nifty Next 50 Vs Nifty Midcap 150 – Which is best?“.
As Nifty Midcap 150 is part of Nifty LargeMid 250, sometimes you may face liquidity issues and hence the huge tracking error. Take, for example, the existing Edelweiss Nifty LargeMidCap 250 Index Fund showing the tracking difference as -1.18% for 1 one-year period and -1.3% for since inception period. For an index fund, such a huge tracking difference is unacceptable. However, let us see how these new entrants perform in the future. (Refer to my earlier post to know what is tracking difference “Tracking Difference Vs Tracking Error of ETF and Index Funds“.
As of now, rather than just jumping into any new index fund, try to understand the requirements at first. If you need to, then go ahead. Otherwise, no need to add all index funds to your kitty just because index funds are best compared to active funds.
