

How Much Returns to Expect from Nifty 50? Let us try to get the answer to this question by looking at the Nifty 50 TRI data from 1999 to 2023 (24 years).
Recently Mint published an article where they mentioned the returns possibilities as below.
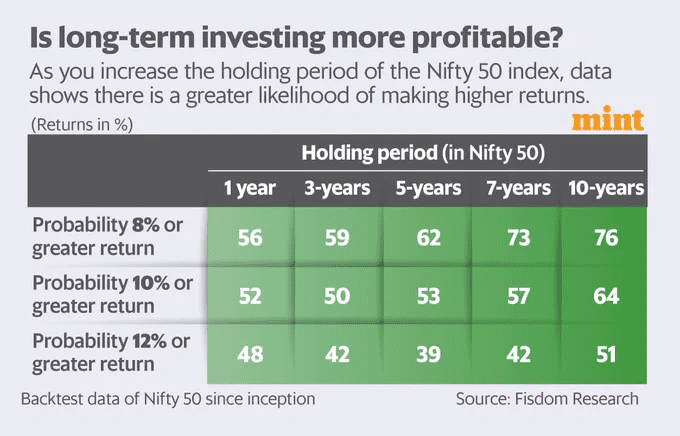
However, I am unsure of whether they considered the divided income also. Hence, in this article, by considering the divided income reinvested option (Toral Return Index), let us try to understand the possible returns investors generated from the 1999 to 2023 period.
The TRI data is available from 1999 and hence I have taken it from there. For our study, we have around 6,029 daily data points.
One more clarity does not emerge from the above image. When they say more than 8% returns, then whether it is 8% to 10% or more than 8%. Instead, I thought to study the return possibilities for various periods like 1 year, 3 years, 5 years, and 10 years. Also, rather than having a plain three categories of what Mint published, I have segregated the returns data into less than 0%, 0% to 8%, 8% to 10%, 10% to 12%, 12% to 15%, and above the 15%. This I think will give us a clear picture.
How Much Returns to Expect from Nifty 50?
To understand the volatility, let us try to understand the drawdown of the Nifty from 1999 to 2023. Drawdown in simple words is how much the value of the investment has fallen from its earlier peak.
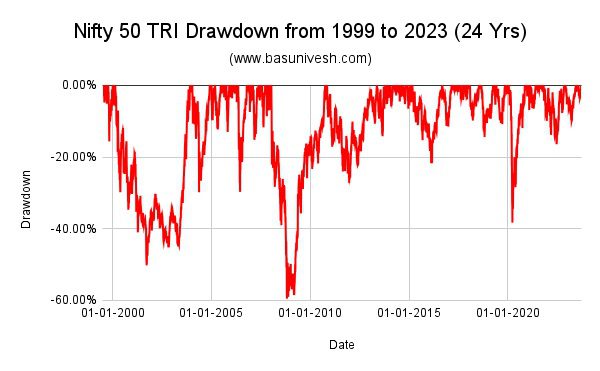
Notice the big drawdown of almost 60% during the 2008 market crash and also during the Covid crash.
To understand the return possibilities, let us try to understand by taking examples of the 1-year, 3-year, 5-year, and 10-year rolling returns.
# Nifty 50 1 Year Rolling Returns from 1999 to 2023

Look at the huge deviation and volatility visibility from this data. During the 2008 market crash, the 1-year returns dropped to almost around 50%. The maximum return was 110%, the minimum was -55% and the average was 16%.
# Nifty 50 TRI 3 Years Rolling Return (1999 to 2023)
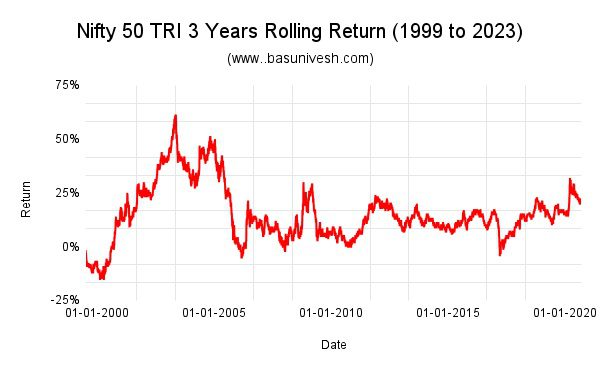
Even though the negative returns possibility is reduced drastically, you can still expect volatility for 3 years of rolling returns. The maximum return was 61%, the minimum was -15% and the average was 15%.
# Nifty 50 TRI 5 Years Rolling Return (1999 to 2023)
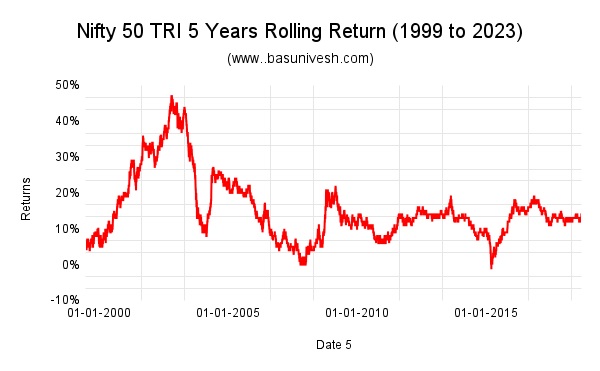
Notice that for year periods, the negative returns are looking thin. But volatility seems to be part of the journey. The maximum return was 47%, the minimum was -1% and the average return was 15%.
# Nifty 50 TRI 10 Years Rolling Return (1999 to 2023)
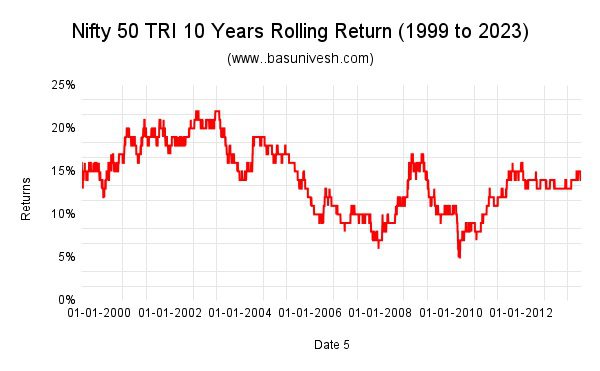
For those who invested for 10 years or more during the last 24 years, the possibilities of negative returns are almost zero. But it does not mean the journey is smooth. Volatility is reduced when you compare it to other above data. But still, you may notice the volatility. Hence, the journey of 10 years of holding is not so smooth like how the financial industry tells us by looking at point-to-point returns.
During this period, the maximum returns for 10 year holding period were 22%, the minimum was 5% and the average was 14%.
By looking at all the above data, those who are actually concentrating on maximum returns may assume that 1-year returns are fantastic. But be ready for the -55% downtrend in your invested value as both positive and negative are possible for such a short period.
The same applies to 3 years period also. However, even though the negative return possibility was reduced for 5 years and 10 years periods, but still notice the huge deviation in maximum to minimum returns vs the average returns.
Now let us try to understand what may be the returns during those 24 years by breaking into various return categories.
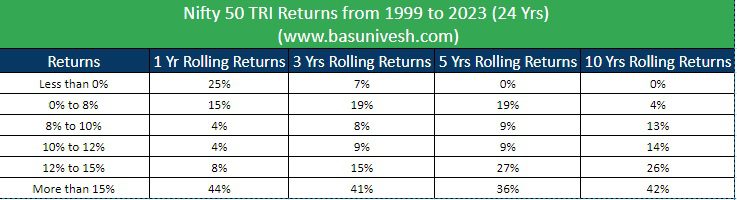
The above image will give you clarity about the return possibilities for various time periods. Notice that the probability of negative returns for 1-year rolling returns is almost 25% and from 0% to 8%, it is 15%. Hence, we can assume that the probability of generating less returns for 1 year holding period is almost 40%.
If you are expecting 12% returns or more for 1 year period, then the probability is 52% with a 40% risk of generating less than 8% returns.
Notice the return possibilities for more than 10% or 12% for the holding periods of 3 years, 5 years or 10 years, you noticed that probability is slowly increasing proportionately the probability of generating less than 8% returns decreases.
What all these data indicate is that if your holding period is more than 5 years or 10 years, then better to expect 10% with a downside risk of 28% and 17% generating less than 10% returns. It means even if you assume a 10% conservative number for your 5-year to 10-year holding period, the failure possibility of generating less than 10% is 28% and 17% respectively.
Hence, never run behind fair recent returns to assume that the future is the same way. Instead, look for the bigger picture like above and notice the LUCK factor also even after holding for medium term (like 5 years) to long term (10 years).
Conclusion – Past returns are not an indication of future returns. However, by looking at past data, you can conclude the return possibilities and accordingly be ready to face downtrends. Just because someone generated 10% or more returns or the fund generated 10% or more returns does not mean you must assume that it may be possible in the future too. It may be possible and may not be. Prepare for what if you are not able to generate the expected return and at the same time hope for better returns. But be realistic rather than expecting too much or a kind of magic. Anything expecting more than 10% from your equity portfolio for your medium to long-term goals (more than 5 or 10 years) is highly risky. Also, from the above data, it is proved that even after holding for a medium to long term, the possibility of less than 10% return is possible!!
