One of my favorite responsibilities as chief investment officer at Ritholtz Wealth Management is the quarterly conference call I do for our clients: 30 charts in 30 minutes that explain where we are in the economic cycle, what markets are doing, and what it means to their portfolios. I always finish with a thought-provoking, often “investing-adjacent” idea they might not have previously considered.
This quarter, it was Sentiment. I’ve gotten so many emails about those last few slides I decided to share that offline discussion here.
My recent sentiment discussions have focused on two things: The general unreliability of surveys — asking people questions and then assuming their answers are accurate or honest; people are loathe to say “I don’t know.” 1
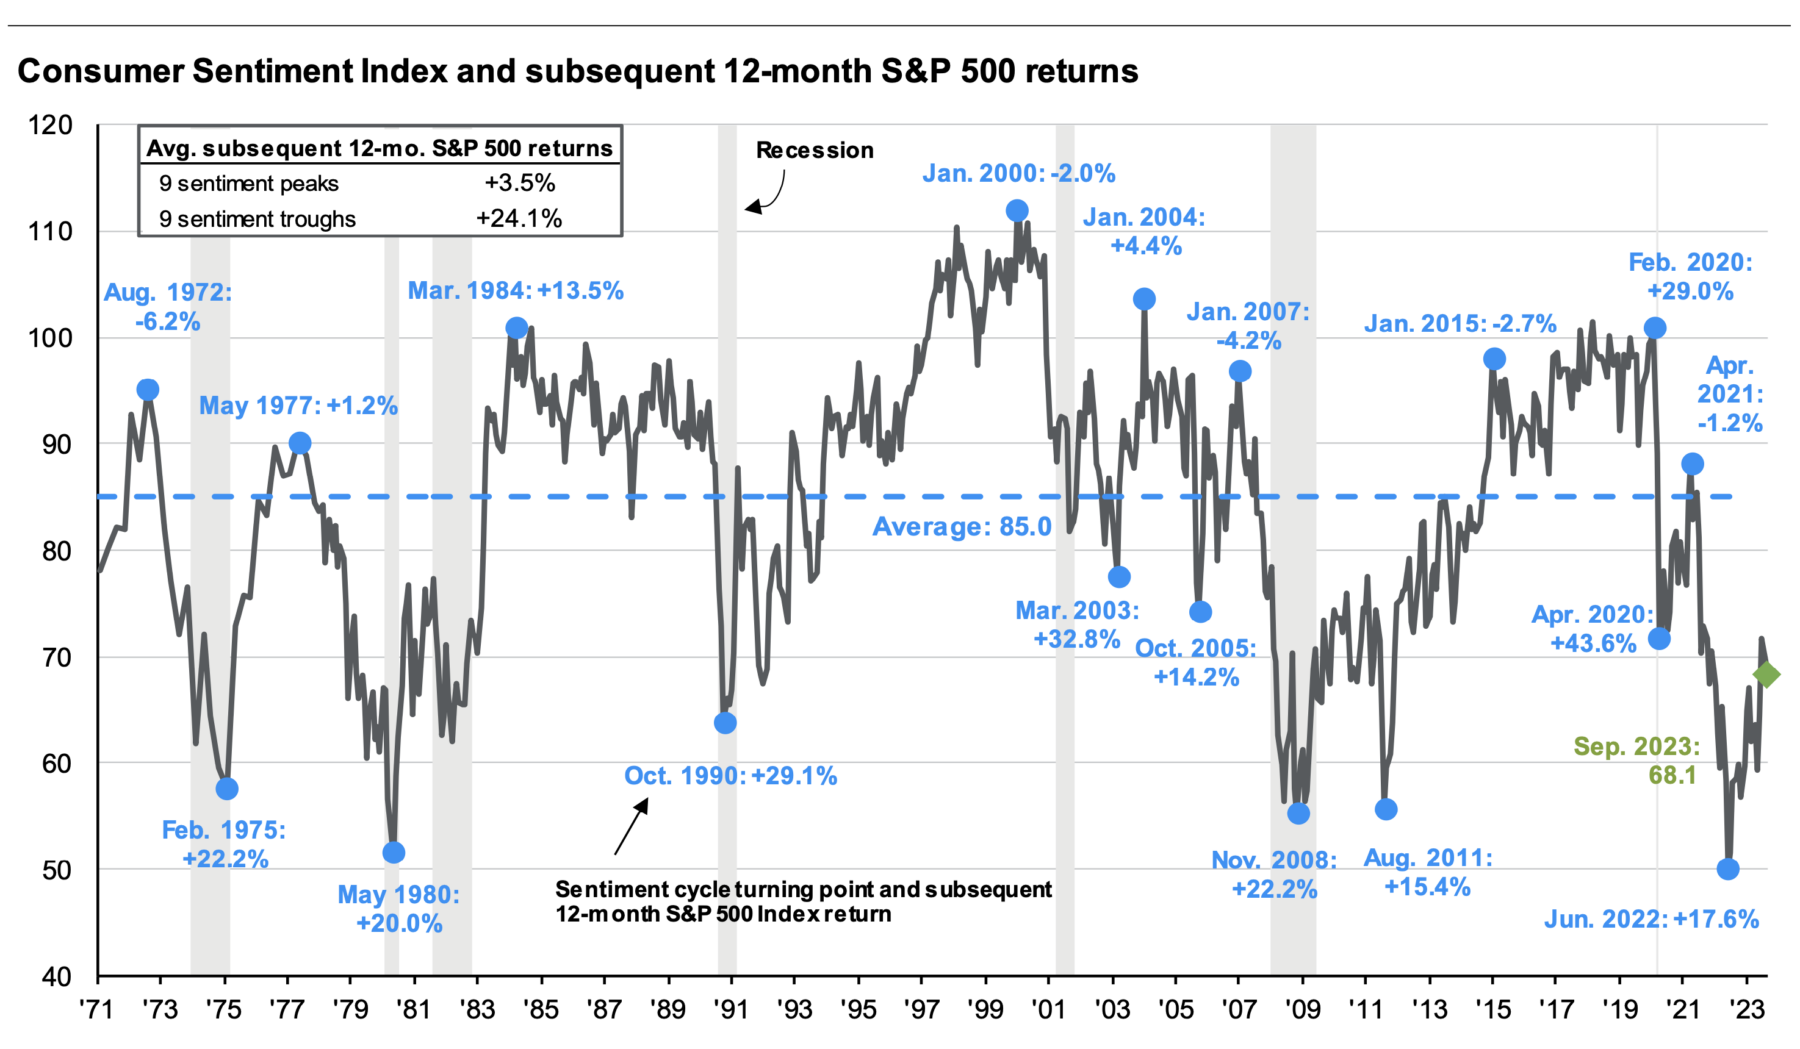
The second issue is simply how astounding survey data has been over the past few years; e.g., people’s self-reported emotional state in 2022 was worse than the very worst events of the past few decades.2
Regardless, something is amiss.
From an economic standpoint, things are much better than people seem to be willing to admit: The rate of inflation has plummeted by two-thirds from 9% to a little over 3%, but 60% of respondents believe inflation is “continuing to increase.” The economy is not on the right track, even as Americans’ Net Worth Surged by Most in Decades During Pandemic.
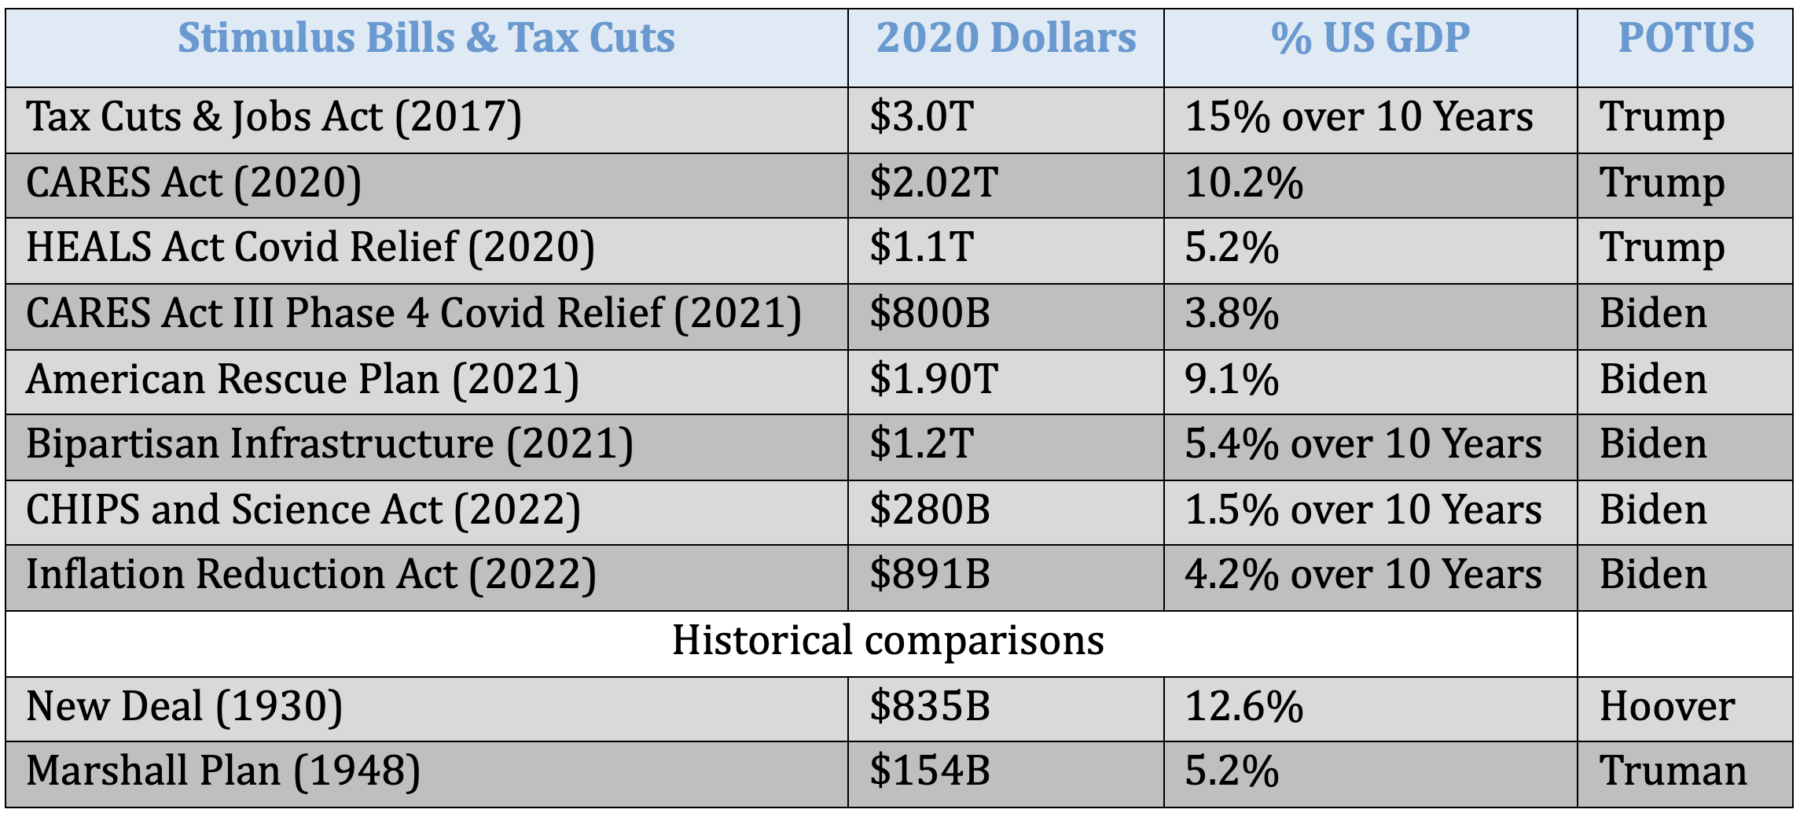
Since 2019, Households invested more, home values jumped, and savings levels have risen. Recent gains driven by fiscal stimulus have reached deeper into the lower economic strata than the gains we saw in the 2010s, driven as they were by monetary stimulus, and concentrated in stocks, bonds real estate, and businesses, e..g., among the top 10%.
While the recent gains were accompanied by an inflationary surge, it was also the first time in a long while the bottom half of the labor force saw substantial wage gains in a long while. Of course, these two issues are related, as much of the recent inflation can be attributed to all of that fiscal stimulus.
And yet, sentiment readings say people are angrier, believe they are less well off, and say they are more unhappy than ever before. Even if politics and partisanship deserve some blame, what is it that’s driving that? 3 This was evident way back in 2015, when the post-GFC recovery was in full flower but was broadly ignored by much of the population.4
People’s perceptions do not match the data. Why?
Diving deep down this rabbit hole, I pulled some interesting data from the Nieman Media lab at Harvard (via Bruce Melman). Two separate data sets reveal point to a major source of this angst.
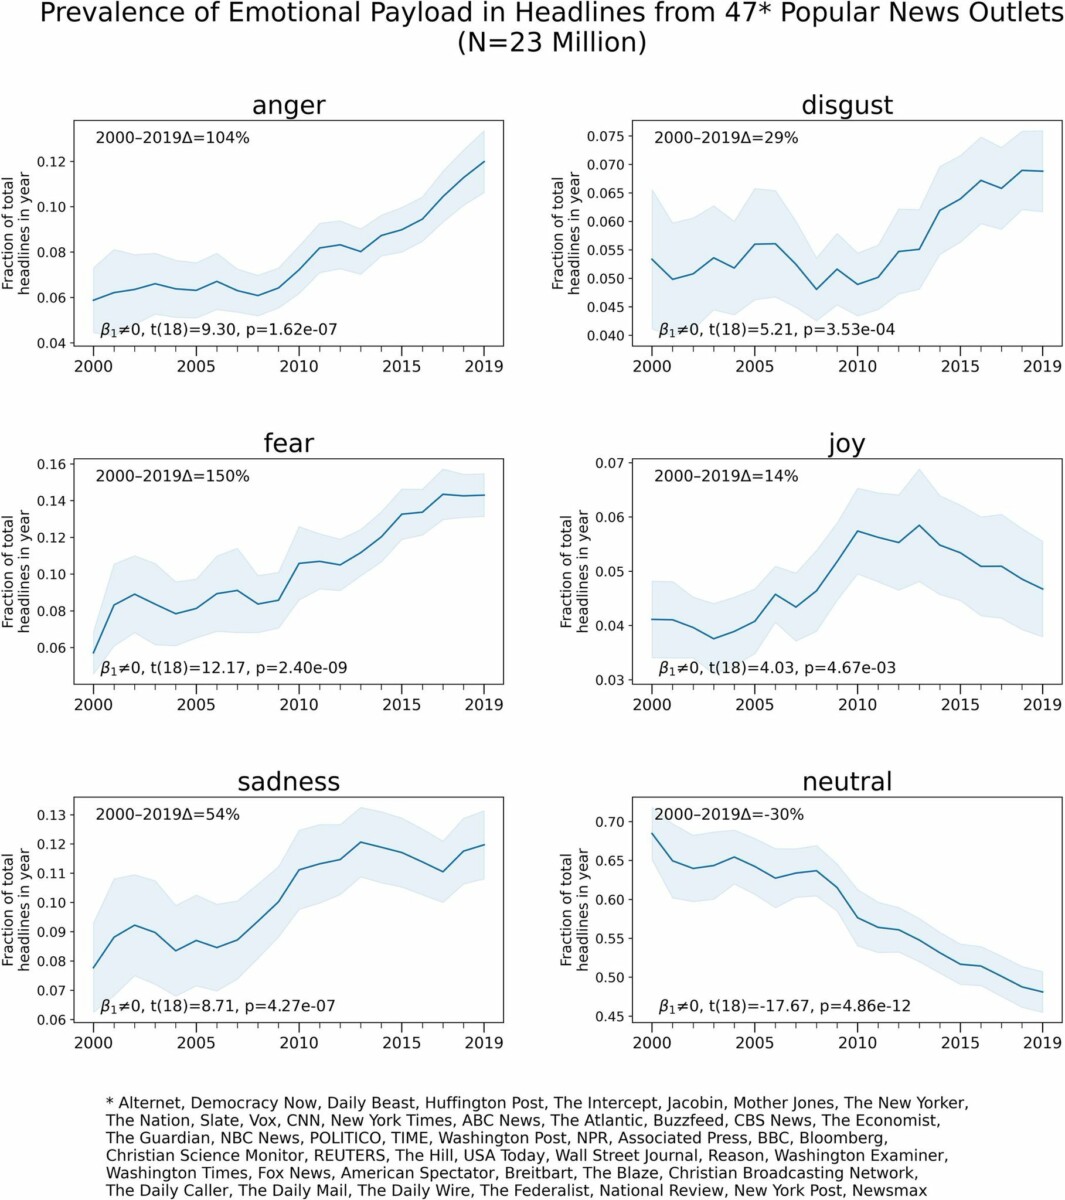
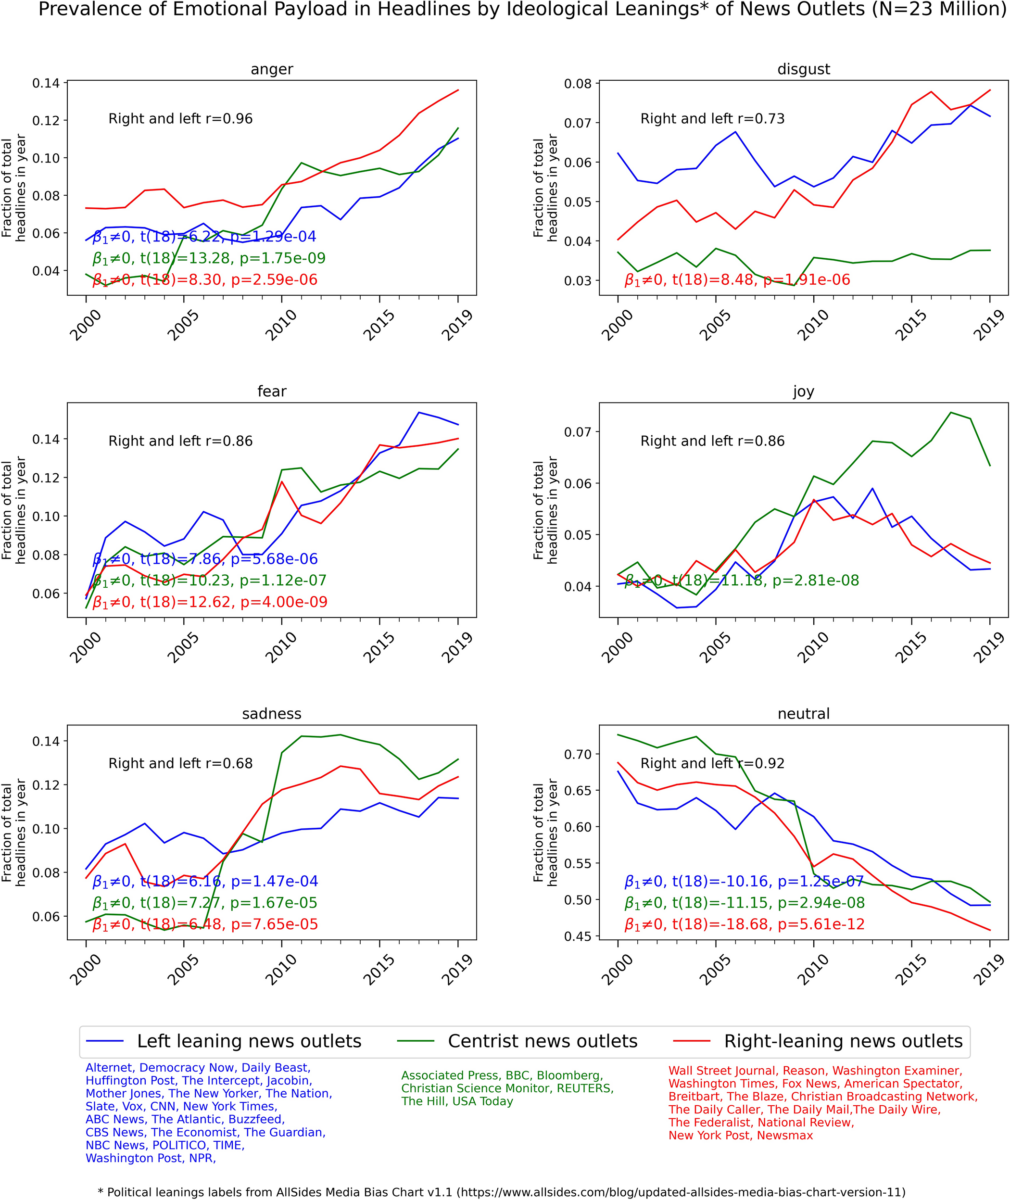
The first is a group of charts covering two decades through 2019, titled “Prevalence of Emotional Payload in Headlines.”
While the past few decades have been challenging to all media companies, the 2010s seems to be when they shifted their online presence to a much more aggressive stance. Perhaps most significant is in the way coverage became increasingly “click-bait” oriented via headlines filled with emotionally loaded language: Words that conveyed “Disgust” rose 29% and “Sadness” was 54% higher; words that reflected “Anger” were up 104%. The biggest gain was from perhaps the most emotionally loaded word: “Fear” skyrocketed by a huge 150%. And the words expressing “Joy” or “Neutral?” Down 14% and 30% respectively. 5
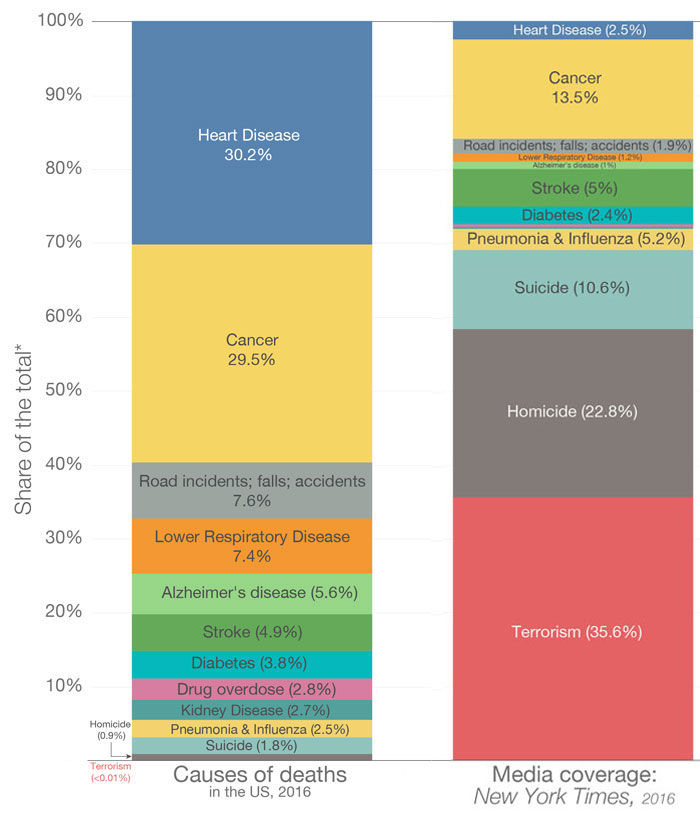
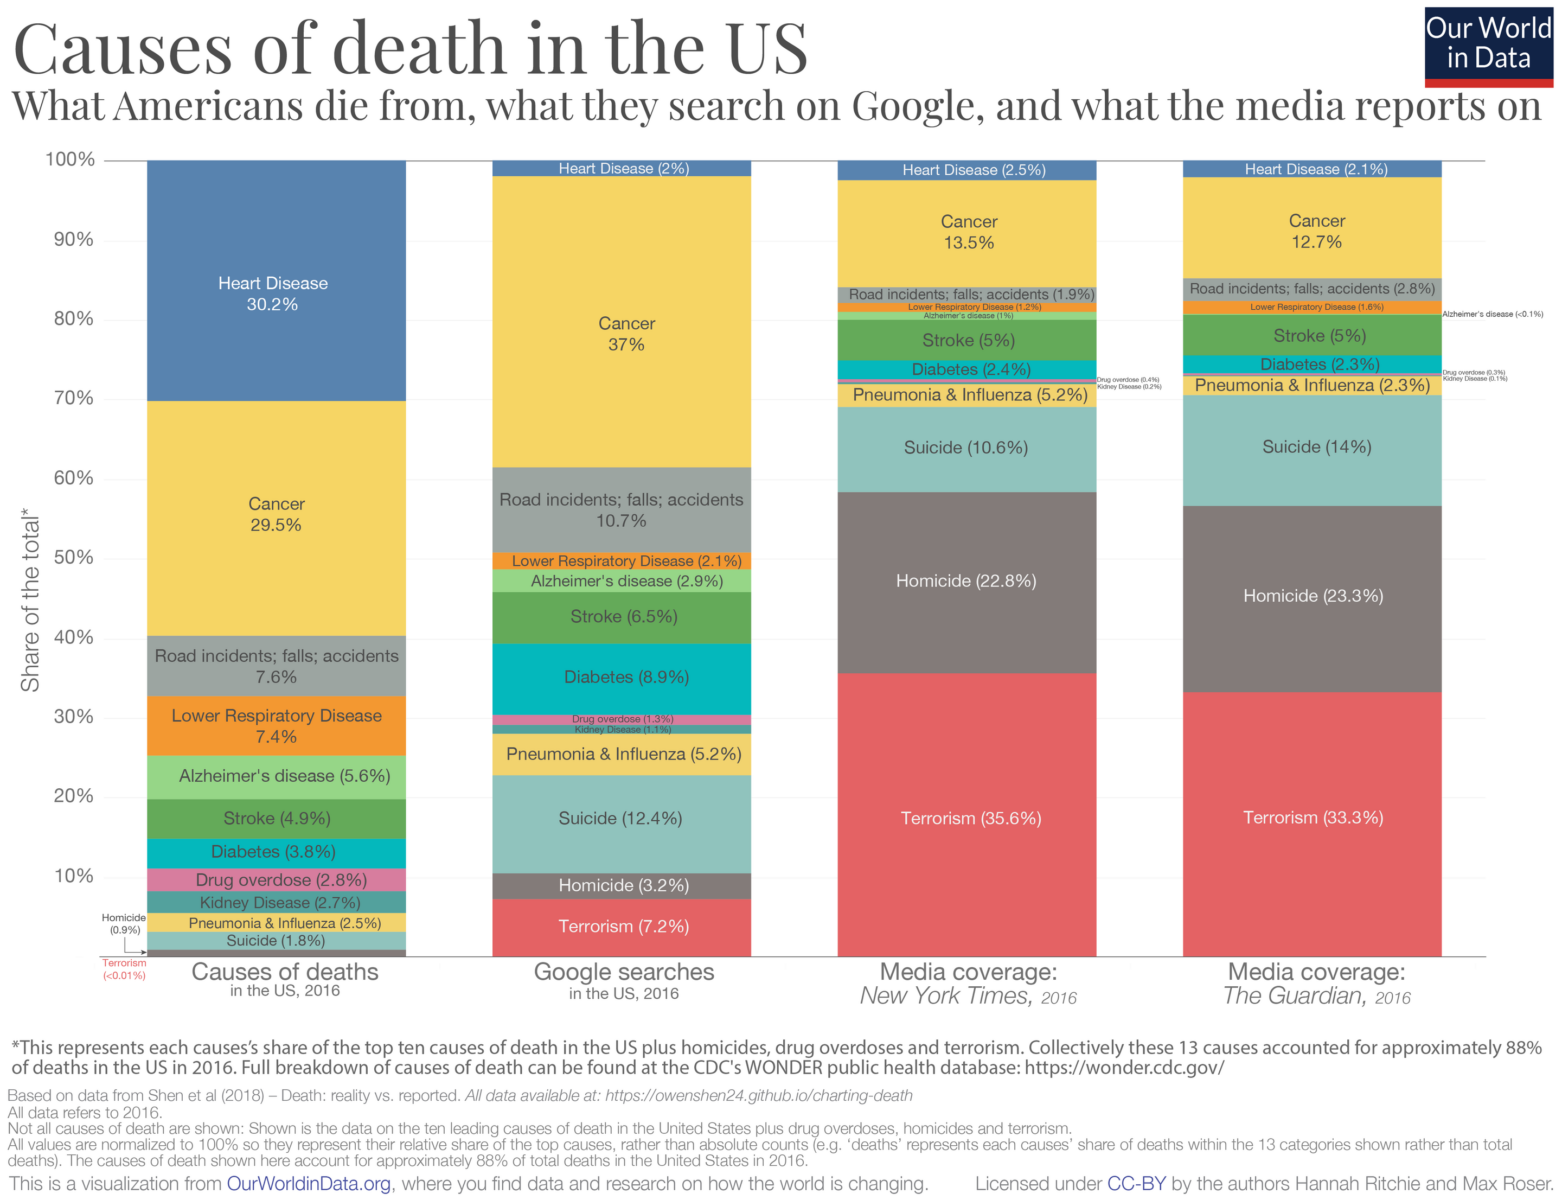
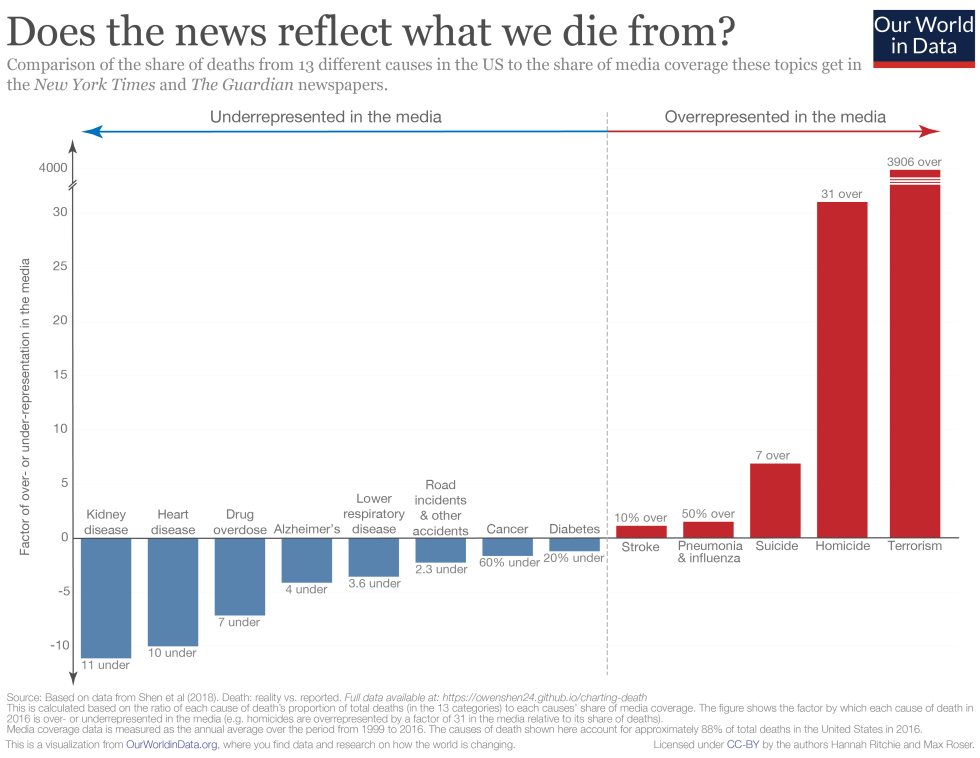
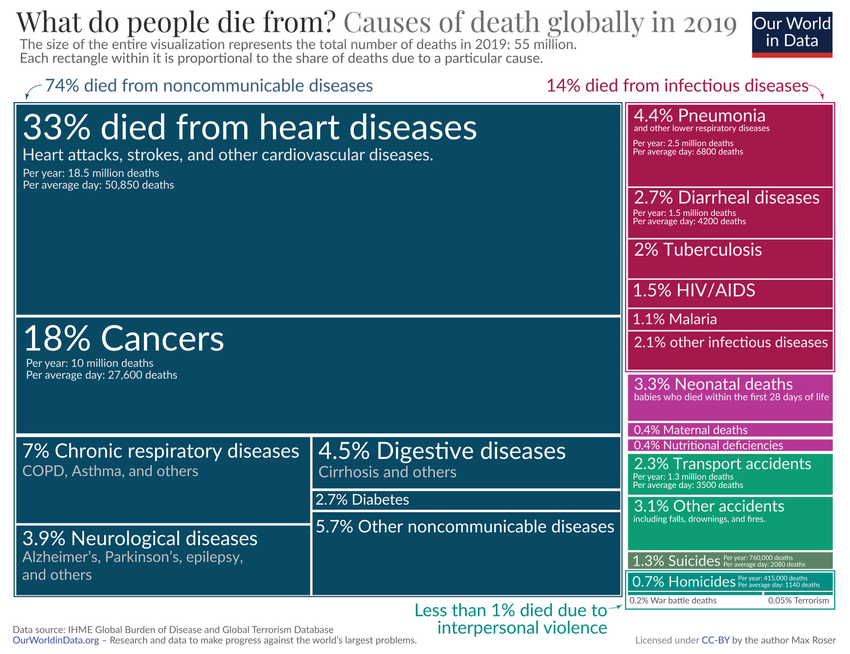
But it’s not just the headlines that create this world; it’s also the choice of topics and focus of media that can lead your understanding of the world astray. Consider causes of death from Our World in Data in the United States:
The odds are you are most likely to die from Heart Disease (30.2%), Cancer (29.5%), a car accident or fall (7.6%), and so on. The very bottom of the list are suicide at 1.8%, homicide at 0.9%, and terrorism at 0.01%.
The way the media covers this is totally inverted: The things least likely to kill you get the most coverage (from most coverage to least): Terrorism, Homicide, and Suicide capture all of the column inches. Heart disease is near the very bottom of coverage.6
I suspect that the combination of these two factors — negatively laden headlines matched with a wildly disproportionate coverage — are combining to send sentiment readings to places that do not match the reality of the economy or more broadly, the real world around us.
There has always been sensationalistic, yellow journalism. The industry has been fighting a losing battle against apps and online services that have crushed much of traditional media’s revenues. The response has been to approach news coverage in a similar algo-driven, dopamine-chasing manner that makes Social media so toxic. If you can’t beat ’em, join ’em seems to be the business plan, even if it makes the rest of us miserable in the process.
We are what we eat, media diet included.
What seems so different today is just how online we are, and the mix of mainstream media with online and perhaps worst of all Social Media. It is making us unhappy, and increasingly detached from reality.
There are genuine problems both here and around the world, but the way we imagine that world is wildly disparate from the way it actually is. This has enormous ramifications for everything from our portfolios, policies and politics…
See also,
Failures’ Fallout (Mehlman, August 21, 2021)
Teens Spend Average of 4.8 Hours on Social Media Per Day (Gallup, Oct 13, 2023)
Americans’ Net Worth Surged by Most in Decades During Pandemic (Bloomberg, Oct. 18, 2023)
The Annoyance Economy: Data alone don’t capture how frustrating and stressful it is to be a consumer right now. (Atlantic, Oct. 19, 2023)
Americans’ Dismal Views of the Nation’s Politics (PEW, September 19, 2023)
Previously:
Is Partisanship Driving Consumer Sentiment? (August 9, 2022)
The Trouble with Consumer Sentiment (July 8, 2022)
Sentiment LOL (May 17, 2022)
Re-Engineer Your Media Diet (February 2, 2017)
Reduce the noise levels in your investment process (November 9, 2013)
More Signal, Less Noise (October 25, 2013)
The Price of Paying Attention (November 2012)
Sources:
Changes in U.S. Family Finances from 2019 to 2022
Survey of Consumer Finances
Federal Reserve October 2023
Causes of Death
By Saloni Dattani, Fiona Spooner, Hannah Ritchie and Max Roser
Our World in Data, (2023)
_________
1. As we discussed this past Summer:
“People really don’t have much luck forecasting the future, they are easily persuaded by members of their own tribes, and they are less than accurate when it comes to understanding their own thought processes. Ask a simple question about the state of the economy or how they are doing, and the results are often a gnarly mass of contradictions. Humans are unreliable narrators of their own stories.” –More Sentiment Nonsense July 28, 2023
I always wonder if the American education system’s obsessive focus on testing is to blame for this…
2. In Is Partisanship Driving Consumer Sentiment? (August 9, 2022) I asked the simple question:
Does it make sense that current sentiment readings are worse than:
1. 1980-82 Double Dip Recession
2. 1987 Crash
3. 1990 Recession
4. 9/11 Terrorist Attacks
5. 2000-2003 Dotcom implosion
6. 2007-09 Great Financial Crisis
7. 2020 Pandemic Panic
Beyond Partisanship as a source of negativity, others have questioned the polling process of calling households with landlines and primarily much older than average demographics as “broken.”
3. Pew Research found “65% say they always or often feel exhausted when thinking about politics…”
4. Uneven Recovery, Noise & Ignorance: Why People Missed the Recovery (November 16, 2015)
5. Sources analyzed include: Alternet, Democracy Now, Daily Beast, Huffington Post, The Intercept, Jacobin, Mother Jones, The New Yorker, The Nation, Slate, Vox, CNN, New York Times, ABC News, The Atlantic, Buzzfeed, CBS News, The Economist, The Guardian, NBC News, POLITICO, TIME, Washington Post, NPR, Associated Press, BBC, Bloomberg, Christian Science Monitor, REUTERS, The Hill, USA Today, Wall Street Journal, Reason, Washington Examiner, Washington Times, Fox News, American Spectator, Breitbart, The Blaze, Christian Broadcasting Network, The Daily Caller, The Daily Mail, The Daily Wire, The Federalist, National Review, New York Post, Newsmax.
6. See chart after the jump showing full NYT, The Guardian, and Google Search results of these topics.
Assorted related graphics and charts
click to make larger
Americans’ Net Worth Surged by Most in Decades During Pandemic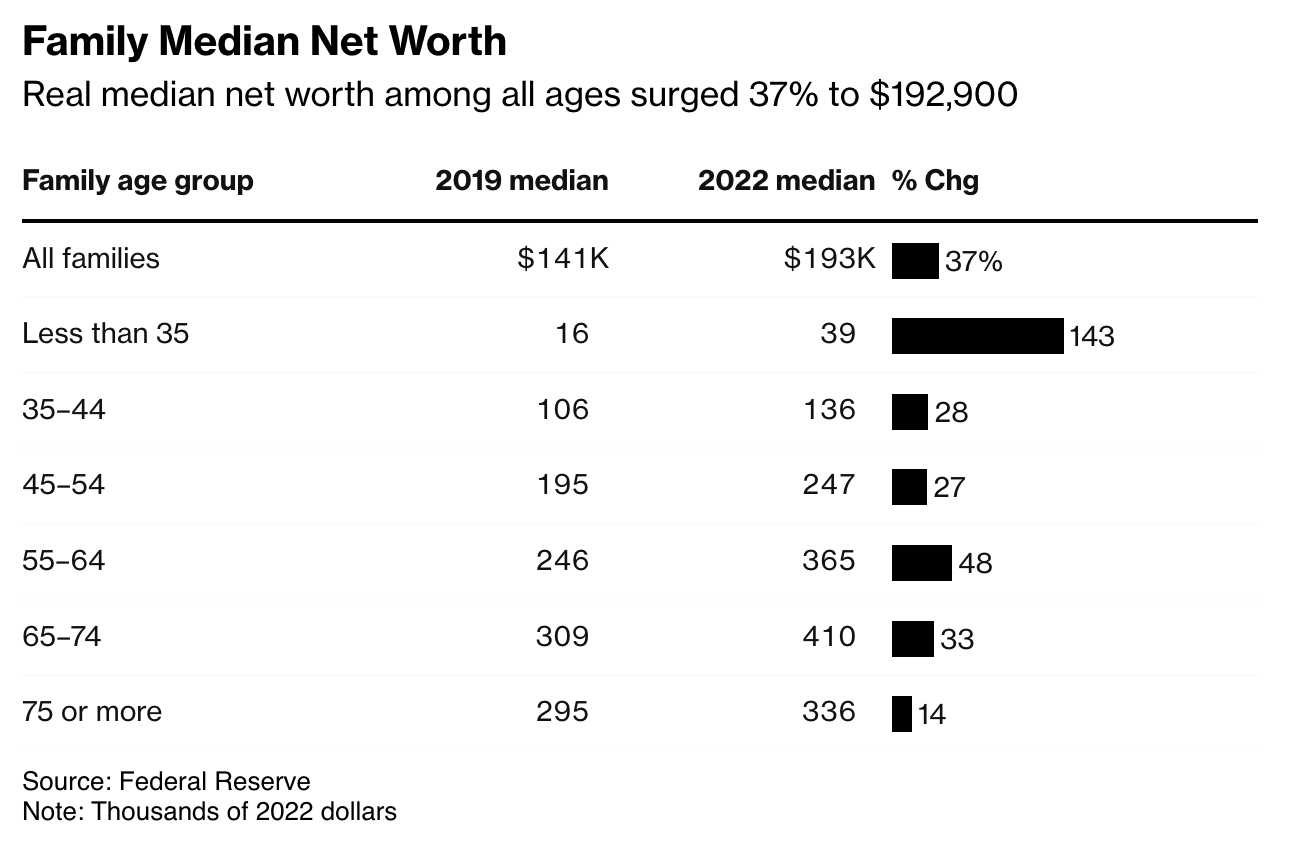
Source: Bloomberg

