Zerodha launched two Index Funds – Zerodha Nifty LargeMidcap 250 Index Fund and Zerodha ELSS Tax Saver Nifty LargeMidcap 250 Index Fund. Should you invest?
As for both funds, the underlying Index is Nifty LargeMidcap 250, so I thought to review both funds in this same article. The schemes are open for subscription from 20th October 2023 and will close on 3rd November 2023.
What is the Nifty LargeMidcap 250 Index?
The Nifty LargeMidcap 250 reflects the performance of a portfolio of 100 large-cap and 150 mid-cap companies listed on the NSE, represented through the Nifty 100 and the Nifty Midcap 150 index respectively. The aggregate weight of large-cap stocks and mid-cap stocks is 50% each and is reset on a quarterly basis.
The index has a base date of April 01, 2005, and a base value of 1000. The Nifty LargeMidcap 250 Index covers approximately 84% of the full market capitalization, around 87% of the free-float market capitalization, and approximately 69% of the total liquidity of all traded equity stocks on NSE based on the 6-month average as of September 29, 2023.
Considering this aspect, I think it is a well-diversified Index than the Total Market Index (Groww Nifty Total Market Index Fund – Should You Invest?). Mainly because the total market index is a capitalized weighted index.
Zerodha Nifty LargeMidcap 250 Index Fund – Should you invest?
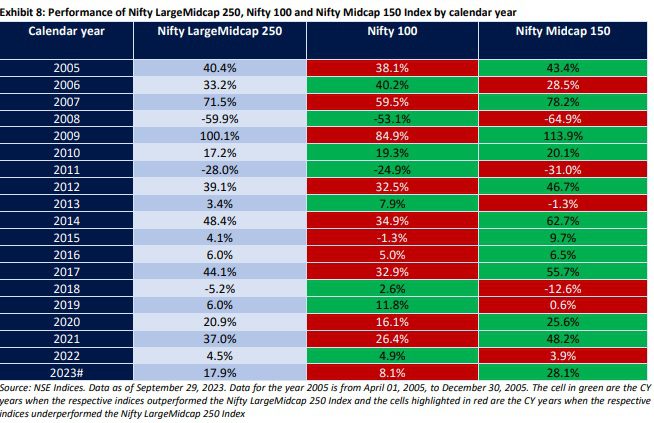
The below table will give you an indication of how the Index performed compared to the Nifty 100 and Nifty Midcap 150 (Souorce NSE Research Paper 4th Oct 2023).
You noticed that in the majority of the cases, the Nifty LargeMidcap 250 Index performed well whenever there was a performance backup from the Nifty Midcap 150 Idnex (if you compare it with the Nifty 100). To validate this point, let us compare the Nifty 50 TRI Vs Nifty Midcap 150 TRI and Nifty LargeMidcap 250 TRI indices.
As the inception date of the Nifty LargeMidcap 250 Index is 1st April 2005, I have considered the same data for Nifty 50 TRI and Nifty Midcap 150 TRI. This gives us around 4,600+ daily data points.
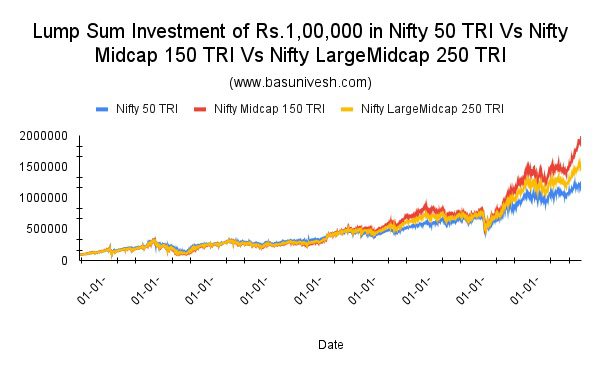
Let us go first with what may be your current values if you invested Rs.1,00,000 in each of these indices.
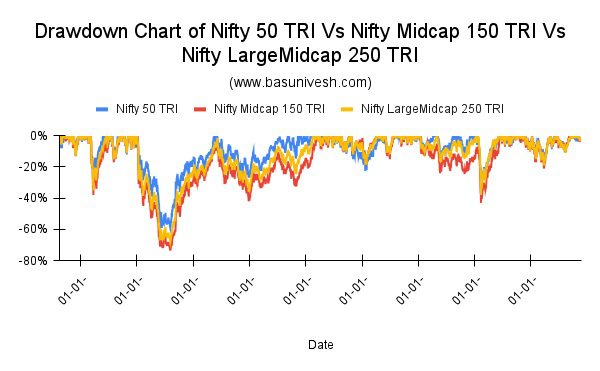
You noticed that the performance of the Nifty LargeMidcap 250 is between the Nifty 50 TRI and Nifty Midcap 150 TRI indices. The final values of Rs.1,00,000 as of the last trading day were Rs.11,91,333, Rs.18,79,794, and Rs.15,14,026 for the Nifty 50 TRI Index, Nifty Midcap 150 TRI Index, and Nifty LargeMidcap 250 TRI Index respectively. The performance of the Nifty Midcap 150 TRI Index looks attractive but comes with risk. Hence, let us try to understand this by looking at the drawdown chart of all these three indices. Drawdown means how much % the Index fell from its earlier peak.
Now you can visualize the risk involved in the Nifty Midcap 150 TRI Index compared to Nifty 50 TRI and Nifty LargeMidcap 250 TRI. Let us now try to understand the performance of all these three indices based on the rolling return concept.
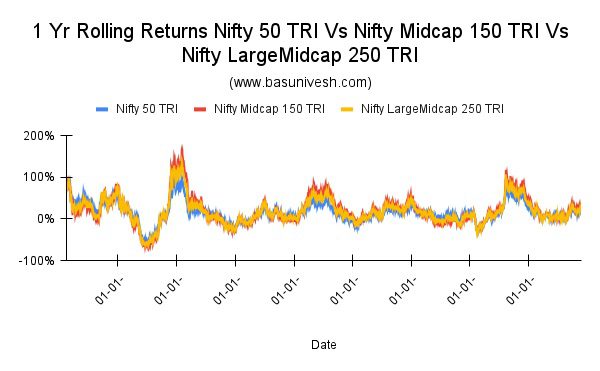
# 1 Yr Rolling Returns Nifty 50 TRI Vs Nifty Midcap 150 TRI Vs Nifty LargeMidcap 250 TRI
You may notice that this will not give us a clear picture of how all three indices performed in comparison. However, the maximum return for Nifty 50 TRI is 100%, the Minimum is -55% and the average is 16%. For the Nifty Midcap 150 Index, the maximum return is 169%, the minimum is -67% and the average is 20%. For Nifty LargeMidcap 250 Index, the maximum return is 138%, the minimum is -62% and the average is 18%. This clearly shows that the Nifty LargeMidcap 250 Index falls between the Nifty 50 and Nifty Midcap 150 Index.
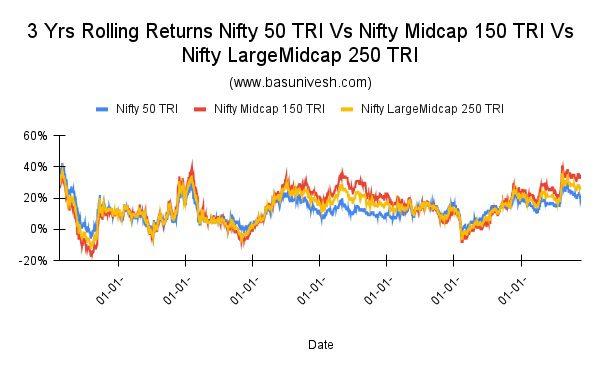
# 3 Yrs Rolling Returns Nifty 50 TRI Vs Nifty Midcap 150 TRI Vs Nifty LargeMidcap 250 TRI
From hereon you can notice that whenever the Nifty Midcap 150 Index performed better than the Nifty 50 Index, then the Nifty LargeMidcap 250 also outperformed the Nifty 50 Index.
The maximum return for Nifty 50 TRI is 42%, the Minimum is -6% and the average is 12%. For the Nifty Midcap 150 Index, the maximum return is 41%, the minimum is -17% and the average is 15%. For the Nifty LargeMidcap 250 Index, the maximum return is 38%, the minimum is -12%, and the average is 14%. This clearly shows that the Nifty LargeMidcap 250 Index falls between the Nifty 50 and Nifty Midcap 150 Index.
# 5 Yrs Rolling Returns Nifty 50 TRI Vs Nifty Midcap 150 TRI Vs Nifty LargeMidcap 250 TRI
Here also, you can clearly visible the outperformance reason of the Nifty LargeMidcap 250 Index Vs the Nifty 50 Index.
The maximum return for Nifty 50 TRI is 24%, the Minimum is -1% and the average is 12%. For the Nifty Midcap 150 Index, the maximum return is 29%, the minimum is -2% and the average is 14%. For the Nifty LargeMidcap 250 Index, the maximum return is 25%, the minimum is -2%, and the average is 13%. This clearly shows that the Nifty LargeMidcap 250 Index falls between the Nifty 50 and Nifty Midcap 150 Index.
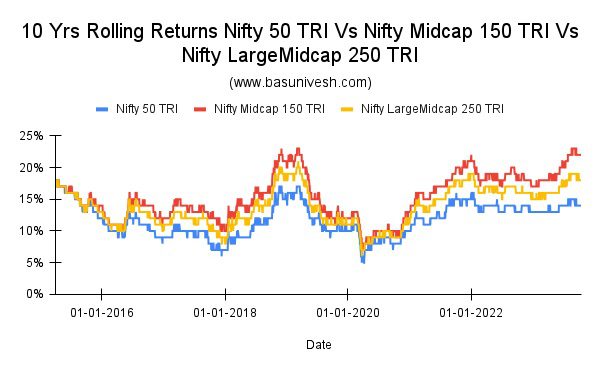
# 10 Yrs Rolling Returns Nifty 50 TRI Vs Nifty Midcap 150 TRI Vs Nifty LargeMidcap 250 TRI
The 10-year rolling returns will give you more and more clarity than the earlier rolling returns. Nifty LargeMidcap 250 performed fantastically when the performance of the Nifty Midcap 150 Index jumped up and performed well.
The maximum return for Nifty 50 TRI is 18%, the Minimum is 5% and the average is 12%. For the Nifty Midcap 150 Index, the maximum return is 23%, the minimum is 7% and the average is 15%. For the Nifty LargeMidcap 250 Index, the maximum return is 21%, the minimum is 6%, and the average is 14%.
If you look at the returns based on calendar years and how the spread is, then the below chart from the NSE research paper will give clarity.
Since 2005, the Nifty 100 Index has delivered greater than 30% annual returns in 7 calendar years and the Nifty LargeMidcap 250 Index outperformed the Nifty 100 Index in 6 out of these 7 calendar years (outperformed in 2005, 2007, 2009, 2012, 2014, and 2017). The Nifty 100 Index had negative returns in 3 years (2008, 2011, 2015), and the Nifty LargeMidcap 250 Index has underperformed the Nifty 100 Index in 2 out of these 3 years (2008, 2011). The only exception was in 2015, when the Nifty 100 Index returned -1.3%, but the Nifty LargeMidcap 250 Index outperformed and returned 4.1% in that year due to the exposure to midcap stocks through the Nifty Midcap 150 Index which delivered 9.7%.
Conclusion –
- Considering the above data from 2005 to 2023, we can conclude that due to its midcap exposure, the Nifty LargeMidcap 250 Index outperformed the Nifty 50 Index. This outperformance is not free of cost. It comes with risk also (due to the 50% inclusion of the Nifty Midcap 150 Index).
- However, those who are looking for a single fund than two funds (Nifty 100/Nifty 50 plus Nifty Midcap) can look for this fund. But beware of the risk and volatility of the Index.
- As it is a new fund, we are unsure of the expense ratio they MANAGE (never look for the current mouthwatering low expense ratio, they have all rights to change as and when they feel NEED) consistently in the future and also the fund performance is subject to the tracking error.
- But overall this fund fits well for those who want a simple solution of having exposure to Nifty 100 + Nifty Midcap 150 Index.
- Regarding the Zerodha ELSS Tax Saver Nifty LargeMidcap 250 Index Fund, I strongly suggest you stay away. Mainly because nowadays filling the Sec.80C benefit is far easier. Many will fill this with their EPF, Term Life Insurance Premium, and PPF contribution itself. Hence, you can ignore the Zerodha ELSS Tax Saver Nifty LargeMidcap 250 Index Fund investment.


