Yesterday (November 29, 2023), the Australian Bureau of Statistics (ABS) released the latest – Monthly Consumer Price Index Indicator – for October 2023, which showed a sharp drop in inflation. This release resolves some of the uncertainty that arose when the September-quarter data came out last month, which showed a slight uptick. I analysed that data release in this blog post – Slight rise in Australian inflation rate driven by factors that do not justify further rate hikes (October 25, 2023) and concluded that the slight rise was not a sign of excess spending and would soon resolve. Today’s figures are the closest we have to what is actually going on at the moment and show that the inflation fell from an annual rate of 5.6 per cent in September 2023 to 4.9 per cent in October. The trajectory is firmly downwards. As I show below, the only components of the CPI that are rising are either due to external factors that the RBA has no control over and are ephemeral, or, are being caused by the RBA rate rises themselves. The RBA boss was in Hong Kong this week trying to justify the rate hikes by saying that Australian households are coping well. Her analysis is partial and ignores the massive distributional differences arising from the interest rate increases. Justifying the unjustifiable!
Inflation continues to decline sharply in Australia
While this data came out, the new RBA governor was swanning around Hong Kong telling the audience at a so-called ‘High level conference’ that inflation was excessive in Australia and that despite the 11 rate hikes since May 2022, Australian households were still “in a good position”.
I wonder if she has actually asked some households whether they were in a good position.
She also claimed that the RBA rate decisions had impacted unevenly and that:
There are distributional consequences, and we are dealing with the political economy challenges of the distributional issues associated with raising interest rates
Who is dealing with it?
Not the RBA?
Their stated goal is to make those ‘challenges’ worse by pushing up unemployment so that around 140,000 more workers are without jobs.
And those job losses if the RBA has its way will impact mostly on the lower-income families who are also the worst hit by the interest rate increases.
I wrote about that in this blog post – RBA wants to destroy the livelihoods of 140,000 Australian workers – a shocking indictment of a failed state (June 22, 2023).
The ABS Media Release (November 29, 2023) – Monthly CPI indicator rose 4.9% annually to October 2023 – noted that:
The 4.9 per cent increase is down from 5.6 per cent in September and below the peak of 8.4 per cent in December 2022 …
The most significant contributors to the October annual increase were Housing (+6.1 per cent), Food and non-alcoholic beverages (+5.3 per cent) and Transport (+5.9 per cent) …
The annual increase in Rents is lower than the rise of 7.6 per cent in September largely due to the increase in Commonwealth Rent Assistance that took effect from 20 September 2023 and reduces rents for eligible tenants …
Electricity prices rose 10.1 per cent in the 12 months to October reflecting increases in wholesale prices from annual price reviews in July 2023 …
Automotive fuel prices were 8.6 per cent higher in October compared to 12 months ago, due to higher global oil prices. This is down from the annual increase of 19.7 per cent in September.
So a few observations:
1. All the major contributors are in decline.
2. The rent inflation is partly due to the RBA’s own rate hikes as landlords in a tight housing market just pass on the higher borrowing costs – so the so-called inflation-fighting rate hikes are actually driving inflation.
3. None of the other major drivers are sensitive to interest-rate increases, and are declining for reasons unrelated tot he moentary policy changes.
4. The electricity price rises are due to inadequate regulation of the privateised power companies – a failing of government. I wrote about that in this recent blog post – Electricity network companies profit gouging because government regulatory oversight has failed (November 22, 2023).
5. Note that fiscal policy expansion – the Commonwealth Rent Assistance scheme helped reduce inflation rate and gave some relief to households – but not enough.
The Federal government could have done much more to relieve the pressure on households of these temporary cost-of-living rises over the last two years.
The latest ABS data (linked to in the introduction) shows:
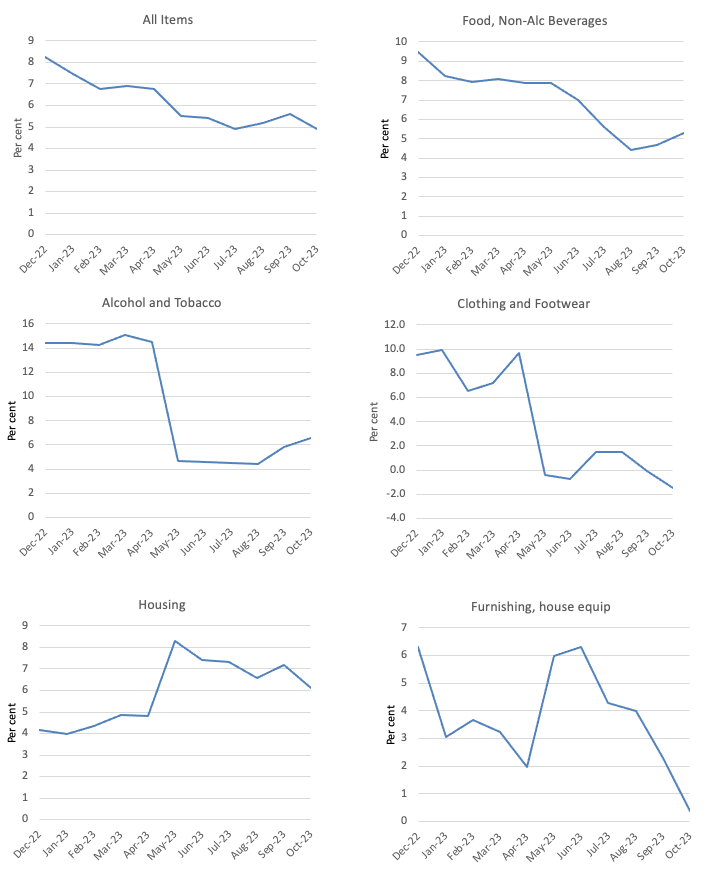
- The All groups CPI measure fell by 0.41 per cent and by 4.8 per cent over the last 12 months (down from 5.5 per cent).
- On an annual basis, food and non-alcoholic beverages fell by 0.2 points.
- Clothing and footwear fell 1.5 points.
- Housing rose 0.8 points.
- Furnishings and household equipment fell 1.5 points.
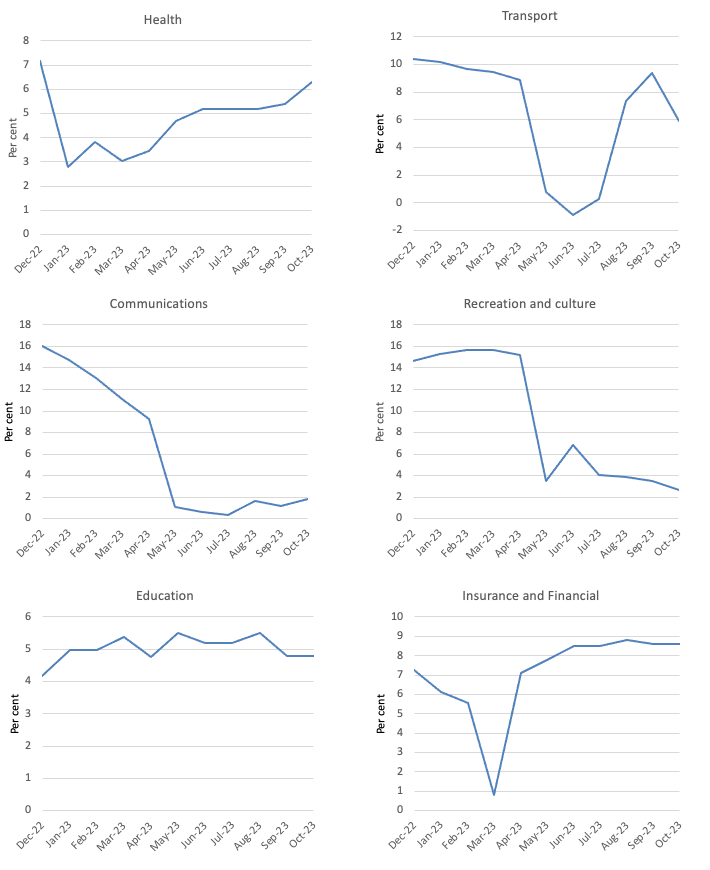
- Health fell 1.7 points.
- Transport fell 0.9 points.
- Communications fell 0.2 points.
- Recreation and culture fell 7.9 points.
- Education fell 1.9 points.
- Insurance and Financial Services rose 0.9 points.
So, significant falls in most major commodity groups.
Note the rise in FIRE services which is, in part, due to the banks gouging profits.
The general conclusion is that the global factors that were responsible for the inflation pressures are abating fairly quickly as the world adapts to Covid, Ukraine and OPEC profit gouging.
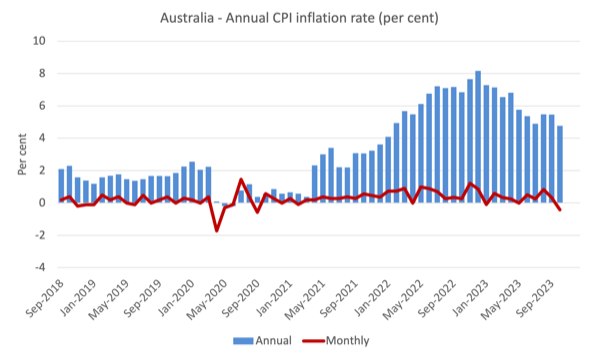
The next graph shows, the annual rate of inflation is heading in one direction – down and quickly.
The blue columns show the annual rate while the red line shows the month-to-month movements in the All Items CPI.
The next graphs show the movements between December 2022 and October 2023 for the main components of the All Items CPI.
In general, most components are seeing dramatic reductions in price rises as noted above and the exceptions do not provide the RBA with any justification for further interest rate rises.
Overall, the inflation rate is declining as the supply factors ease.
The RBA’s fictional NAIRU
In June 2023, the RBA governor (then deputy) claimed the so-called Non-Accelerating-Inflation-Rate-of-Unemployment (NAIRU) was 4.5 per cent and unless the unemployment rate rose to that level inflation would continue to accelerate.
This was just a straightforward application of the mainstream textbook garbage which says that if the unemployment rate is below the NAIRU then inflation accelerates, and, if the unemployment rate is above the NAIRU, then inflation will decline.
The NAIRU, according to the logic defines the state where inflation is stable.
I reject the logic, but let’s run with it to test its internal consistency.
On that basis, even if we accept there is a definable NAIRU that can be measured somehow, the RBA governor’s narrative was plainly wrong.
I wrote about that issue in more detail in this blog post (among others) – Mainstream logic should conclude the Australian unemployment rate is above the NAIRU not below it as the RBA claims (July 24, 2023).
The RBA has now revised their estimate of the NAIRU to 4.25 per cent.
The point is, according to the NAIRU logic, if the unemployment rate is below the NAIRU then inflation should be accelerating and if the unemployment rate is above the NAIRU, then inflation should be decelerating.
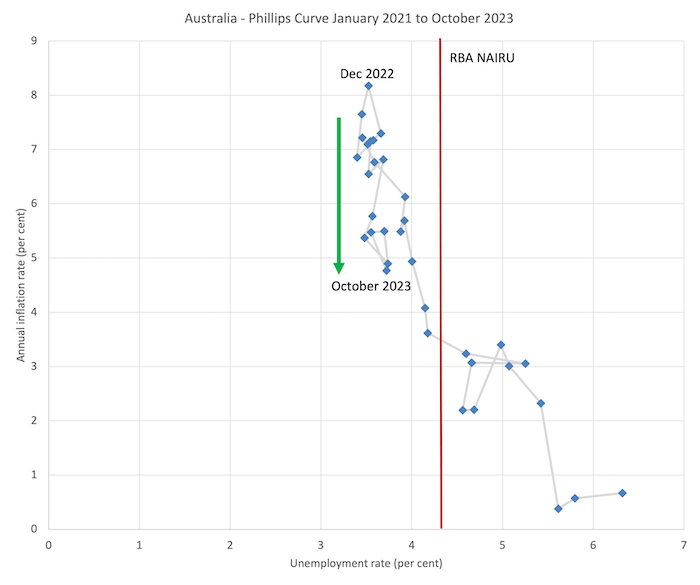
The facts are shown in the graph below which is a Phillips curve graph from January 2021 (just before the inflation rate accelerated) to October 2023.
A Phillips curve graphs the relationship between the unemployment rate (horizontal axis) and the inflation measure on the vertical axis.
In Australia’s case over the last 2 years, the situation is pretty clear.
The unemployment rate has been very stable over the last year but the inflation rate has been falling since last September (green arrow).
Which means that logically, the NAIRU could not be above the current unemployment rate and must be below it.
Which means that the RBA’s insistence on putting 140,000 extra workers onto the unemployment scrap heap has no foundation even in the theoretical structure they believe in.
The vertical red line is the RBA’s NAIRU, which coincides with an inflation rate of just over 3 per cent.
But at that inflation rate there is a wide range of unemployment rates shown – from 4.1 per cent to 5.3 per cent (about) and if I was to do the econometric modelling to estimate the NAIRU formally, I would get a wide confidence interval within which I could not statistically discriminate – in other words the NAIRU estimates are useless for policy.
The NAIRU estimates are just tools used by ideologues who want higher unemployment and more bargaining power to the corporations.
The most recent inflation peak was in December 2022 and it has been declining steadily since with a blip in April 2023.
But look at the range of the unemployment rate within which that decline has been taking place?
Very narrow.
So the NAIRU cannot be at 4.25 per cent if at the current unemployment rate (3.7 per cent) inflation is systematically declining.
It must, in a logical sense, be lower than 3.7 per cent.
Conclusion
The problem with the RBA narrative is that it refers to only a subset of the expenditure categories that household face.
The data that the RBA has cited to justify its claim that households have sufficient financial buffers (from savings) to deal with the extra mortgage payments exclude expenses relating to education and health insurance, both major items for most households.
And there estimates are based on the average, when in fact there is no ‘average’!
It is clear that lower income families are facing massive financial strain – estimates of the proportion of households that have income below their current costs is around 15 per cent.
On the other side, are the wealth holders, mostly older people, who own their own home and have interest-sensitive income or shares in the banks.
That group is partying at present.
Those distributional variations are important but largely ignored in the RBA rhetoric that it pumps out to justify its unjustifiable decisions.
Further, yesterday’s data puts paid to the RBA claim that domestic wages growth is now threatening price stability.
Even though there was some welcome growth in nominal wages in the latest data release from the RBA, inflation is falling fairly quickly.
I covered that data release in this blog post – Australia – stronger nominal wages growth but still below the inflation rate – no justification for deliberately increasing unemployment (November 23, 2023).
That is enough for today!
(c) Copyright 2023 William Mitchell. All Rights Reserved.


