


I was going to write about the acquisition of U.S. Steel today, but I ended up reading a whole lot about the history of the steel industry, so that’ll have to wait until tomorrow. In the meantime, here’s a quick post about macroeconomics.
At this point, most commentators agree that the U.S. is likely to achieve the elusive and much-sought-after “soft landing” — bringing inflation down without hurting employment or wages. In fact, this is actually a much better outcome than what I personally would have called a “soft landing” — this is closer to what I’d have called “immaculate disinflation”.
Economists generally think that there’s supposed to be a short-term tradeoff between inflation and unemployment. Basically, the way you’re supposed to bring inflation down is to throw a lot of people out of work, after which they stop buying as much stuff, which brings down demand, which lowers prices. That’s the “Old Keynesian” way of thinking, and depending on which models and which parameters you use, it’s how a lot of New Keynesian models work too.
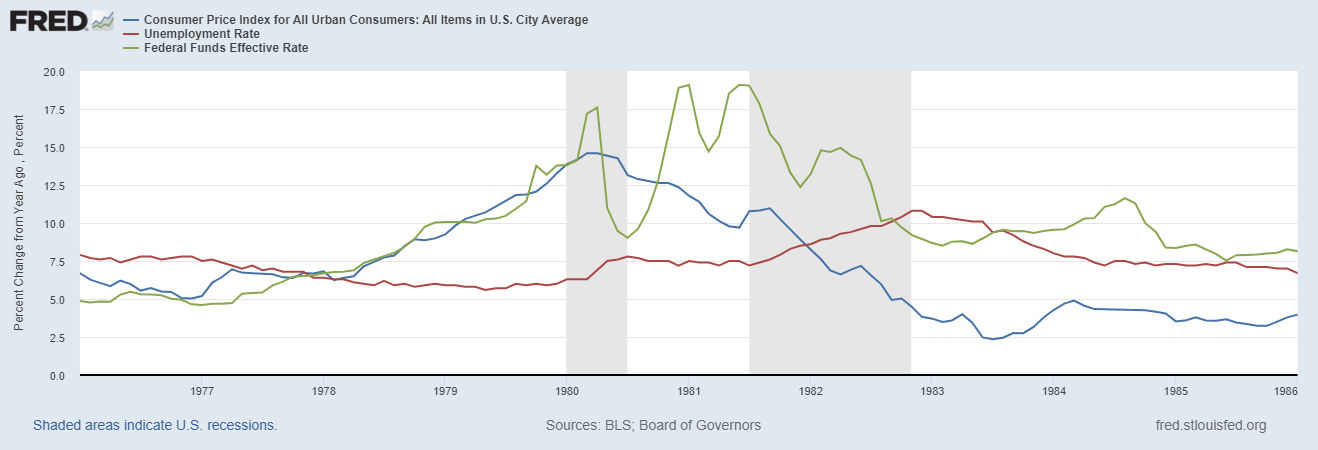
This isn’t just theory, though — this is how it actually worked in the past. Here’s a picture of the years when Paul Volcker ended the inflation of the 1970s. You can see that Volcker hiked interest rates (green), which brought down inflation (blue), but also caused a big rise in unemployment (red):
This was a “hard landing”. And most economists thought that something similar would happen this time around. A survey of 47 economists in mid-2022 found that three-quarters believed a recession was coming before the start of 2024:
So why were the economists wrong, and how did we manage to pull off this feat? There are three basic theories.
This theory, endorsed by Paul Krugman and some other basically Keynesian economists, is that the inflation of 2021-22 was caused mainly by temporary supply shocks, which faded over time.
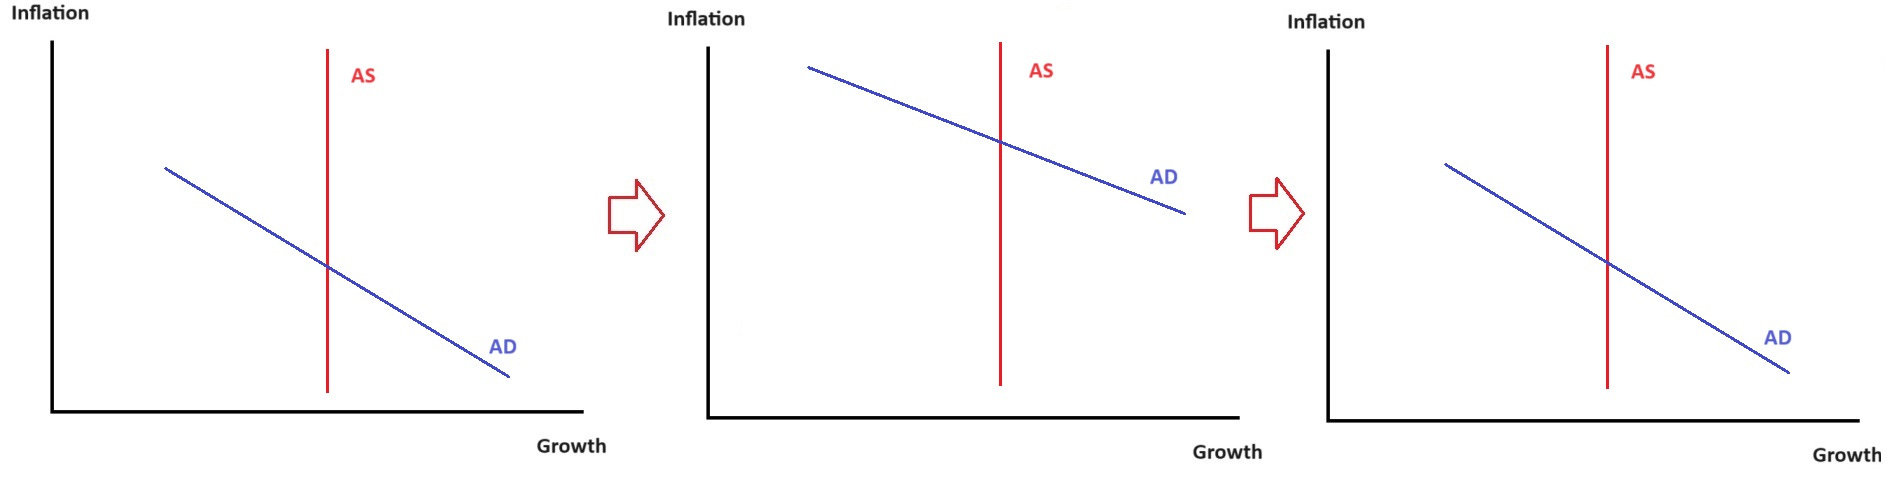
Let’s remember our basic macroeconomic theory of aggregate supply and aggregate demand:
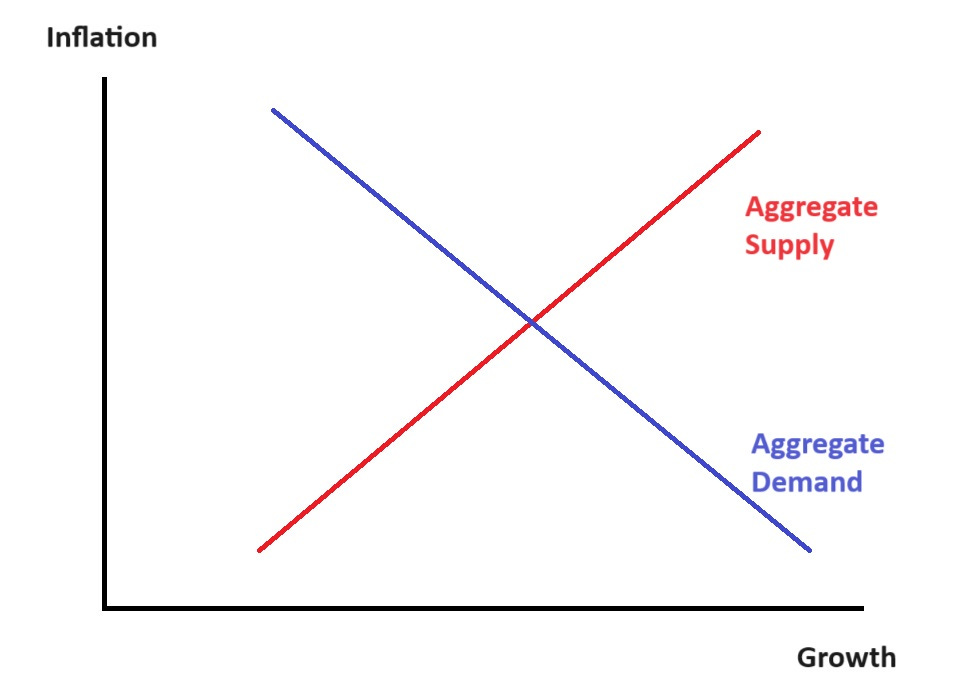
Also, remember that higher growth means lower unemployment.
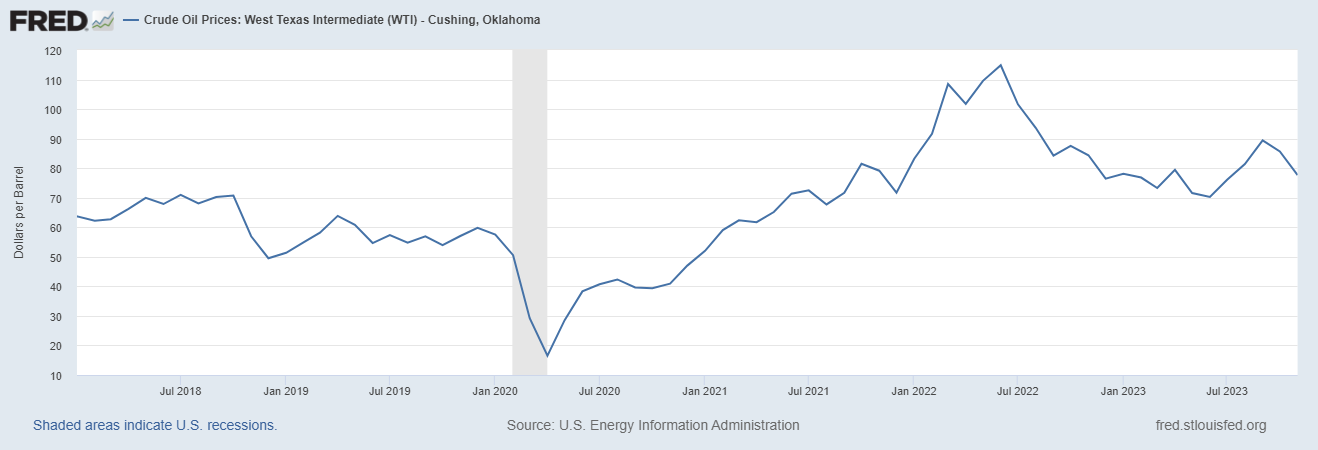
Anyway, after the pandemic we had a bunch of snarled supply chains, and then in early 2022 we got a rapid rise in oil prices from Putin’s invasion of Ukraine. Then supply chain pressures started to ease in 2022 and were back to normal by the start of 2023:
And oil prices fell in late 2022:
So basically, here’s what that sequence of events would look like in the simple AD-AS theory:

Basically, supply bounces back and forth and ends up where it was before. Inflation is temporarily higher and growth is temporarily lower, and then everything goes back to how it was.
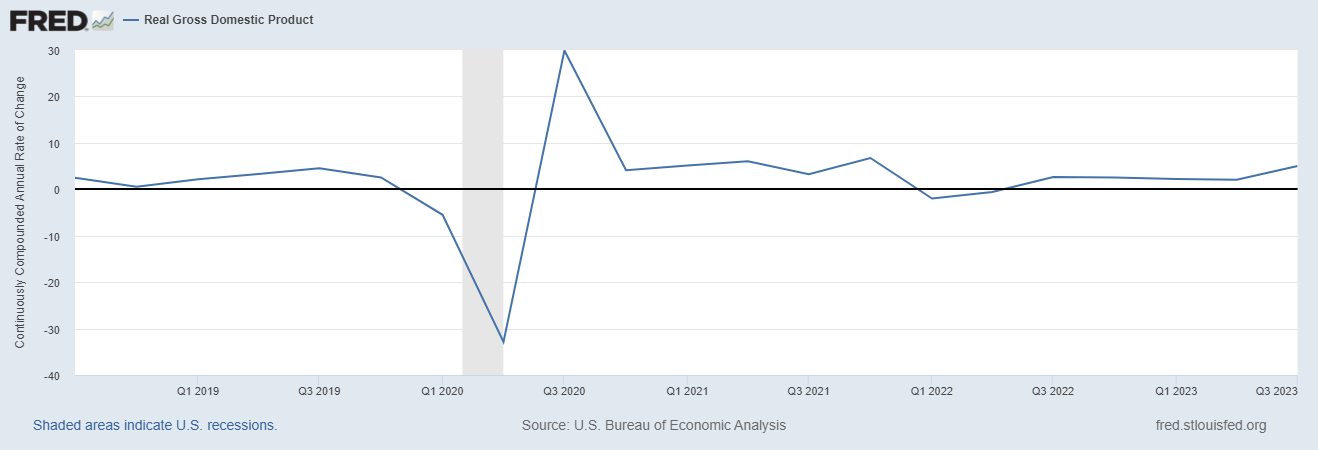
The problem with this theory is…growth didn’t really slow much. It wobbled for a couple of quarters in early 2022, but not enough for a recession to be called:
But supply chains were very stressed out in 2021, and oil prices had already begun rising. Why was growth so strong in 2021? Even if you assume that aggregate demand is very inelastic (i.e. that the blue line on the diagram I drew goes straight up and down), it’s hard to explain why 2021 was such a boom year, if the only thing happening was a negative supply shock.
The other problem with the Long Transitory theory is that it means the Fed’s power to affect either inflation or the real economy is very limited. If raising interest rates from 0% to 5% and massively increasing the federal budget deficit basically does nothing to aggregate demand, it calls into question the whole power of Keynesian stabilization policy. Long Transitory is basically a theory of Fed irrelevance.
The theory of Real Business Cycles (RBC) is actually a lot more complex than the way I’m going to describe it right here, but I think this gets the most simple version across.
Basically, in the context of this simple model, you can think of RBC as saying that aggregate supply moves around on its own — that no matter what happens to aggregate demand, the economy simply produces as much as it’s going to produce. In that case, the only thing that aggregate demand can do is to affect prices. In the words of Ed Prescott, the inventor of RBC theory, this means that monetary and fiscal policy are “as effective in bringing prosperity as rain dancing is in bringing rain” — you can print money and lend money and hand out government checks, but all it’ll do is pump up inflation.
So the RBC story of 2021-2023 would be something like this: In 2020-21, the Fed lowered interest rates to zero and did a ton of quantitative easing and lent out a bunch of money, and the government also ran a huge deficit. But in 2022 it largely stopped doing those things. This created a transitory increase in inflation that eventually ended. But it basically did nothing to the real economy, because in RBC-world, monetary and fiscal policy never affect the real economy.
In the context of our little AD-AS graph, here’s what that would look like:
In this explanation, the Fed made a big mistake — it should have simply sat there and let the free market do its thing, instead of pumping up inflation.
The weakness of this theory is that while it fits the basic facts of 2021-23, it doesn’t fit past experience. Volcker’s interest rate hikes really did seem to raise unemployment to quite a high level. And lots of quantitative research has found that monetary and fiscal policy really do have an impact on the real economy.
So if RBC explains 2021-2023, it’s a mystery as to why it worked this time when it hasn’t worked other times.
The first two theories relied on the idea that only one important thing happened to the U.S. economy in 2021-23. But what if two important things happened? What if there was a transitory demand shock and a transitory supply shock?
Under this “all of the above” explanation, the story goes like this:
-
In 2020-21, the government printed a lot of money and lent a lot of money and borrowed a lot of money, pumping up aggregate demand. But in early 2022 this ended.
-
In 2021-22, supply chains got stressed, and oil prices rose. But in late 2022 this ended.
-
By 2023, both supply and demand were back to normal.
In the context of our little AD-AS model, here’s what that looks like:
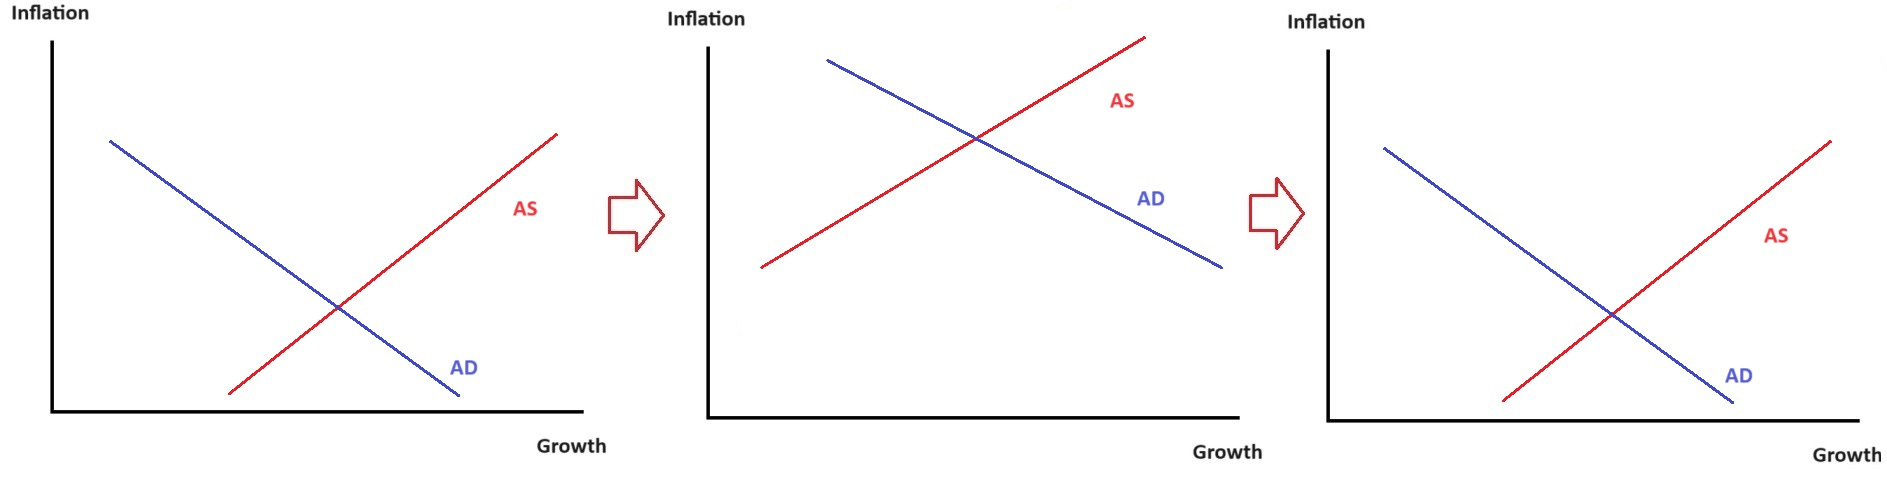
Basically, inflation rises and then falls (leaving prices permanently higher than before), while growth isn’t really affected.
That…kind of looks like what happened! And in fact, the differential timing of the demand and supply shocks can even explain why growth was strong in 2021 and stumbled a bit in early 2022 — the negative supply shocks came a little later than the positive demand shocks, so in early 2022 the economy was hit by oil prices even as government was no longer giving things a boost.
So this theory is very good at explaining what happened over the last three years. The problem is that it’s not very parsimonious. The great scientist John von Neumann is said to have remarked “with four free parameters I can fit an elephant, with five I can wiggle his trunk”. We reward theories for being simple, because complex theories make things too easy.
But that said, sometimes the real world just isn’t parsimonious. A macroeconomy is a very complex thing, with a lot of moving parts, and everything tends to happen all at once. So maybe 2021-23 just isn’t a simple story at all, much as we might prefer it to be one.
Note that in this explanation, the Fed might have made a mistake in 2020-21. This hybrid theory holds that the Fed boosted growth at the price of causing more inflation, and whether that was a good tradeoff depends on which of those things you care about more. But in 2022, according to this theory, the Fed did exactly the right thing — it reduced aggregate demand just as aggregate supply was righting itself, leading to lower inflation without slower growth.
There’s one more theory I should mention here — the theory of expectations.
Modern macroeconomic models aren’t usually as simple as the little AD-AS graphs I drew above. One way they’re more complex is that they allow for a big role for expectations. In these models, if people believe that Fed policy will be very dovish toward inflation in the future, they raise their prices today, and inflation goes up. But if people believe that the Fed will be hawkish in the future, they’ll expect lower inflation, and they won’t raise prices today, and inflation will go down.
According to this theory — which macroeconomist Ricardo Reis used in September 2022 to successfully predict a fall in inflation — the Fed can get something close to immaculate disinflation if it can manage expectations effectively. And as a bonus, expectational effects happen fast — they don’t have to filter through a years-long chain of causality, from high rates to high unemployment to lower consumer spending to lower prices.
In other words, according to expectations management theory, Fed rate hikes in 2022 convinced the country that the spirit of Paul Volcker still animates the institution, and that high inflation will simply not be allowed to persist, then perhaps the Fed beat inflation without having to raise rates so high that they threw people out of work. So in this story, as in the previous one, the Fed did a great job in 2022.
How plausible is this story? We can observe the financial market’s inflation expectations directly, by looking at the 5-year breakeven. This shows that inflation expectations rose strongly in 2021, then spiked even higher in early 2022 before falling to only a little higher than their pre-pandemic average:
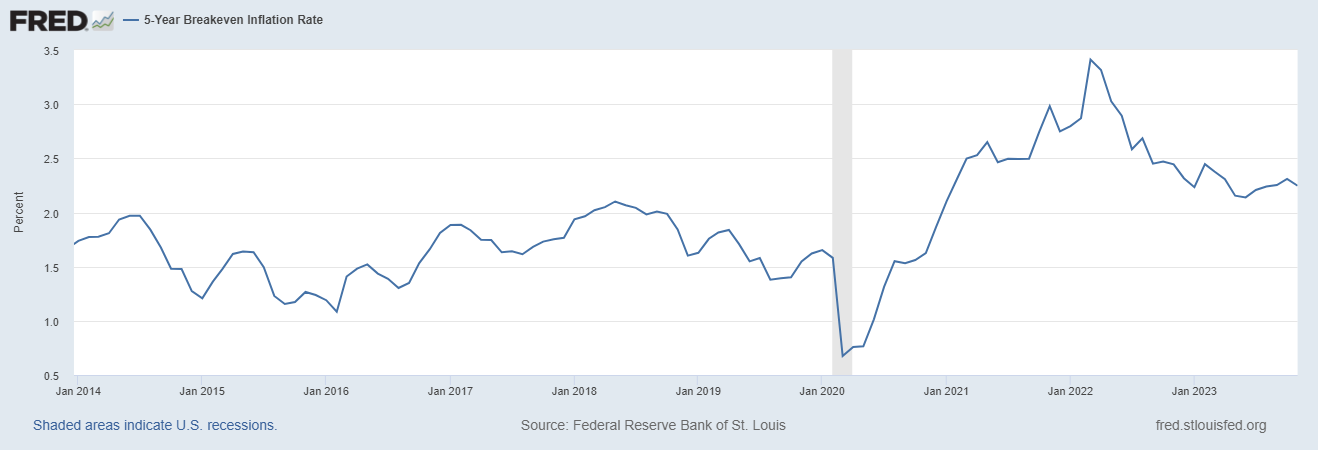
Reis has argued that the true impact of expectations was even bigger than what this graph might suggest, because it contained considerable skewness — there were a lot of people who were paying a lot of money to hedge against very high inflation. (There could be other reasons for that pattern, but it’s suggestive.)
But although this pattern might seem roughly consistent with the expectations story, alternative explanations are also possible — for example, maybe expectations just follow actual inflation, and don’t matter much at all. As usual in macroeconomics, it’s pretty hard to prove what’s causing what.
So anyway, those are the four basic simple theories of how the U.S. achieved a soft landing. You can choose for yourself which set of assumptions you find the most plausible here, and decide which theory is your favorite. As for me, I’m just glad it all worked out.
