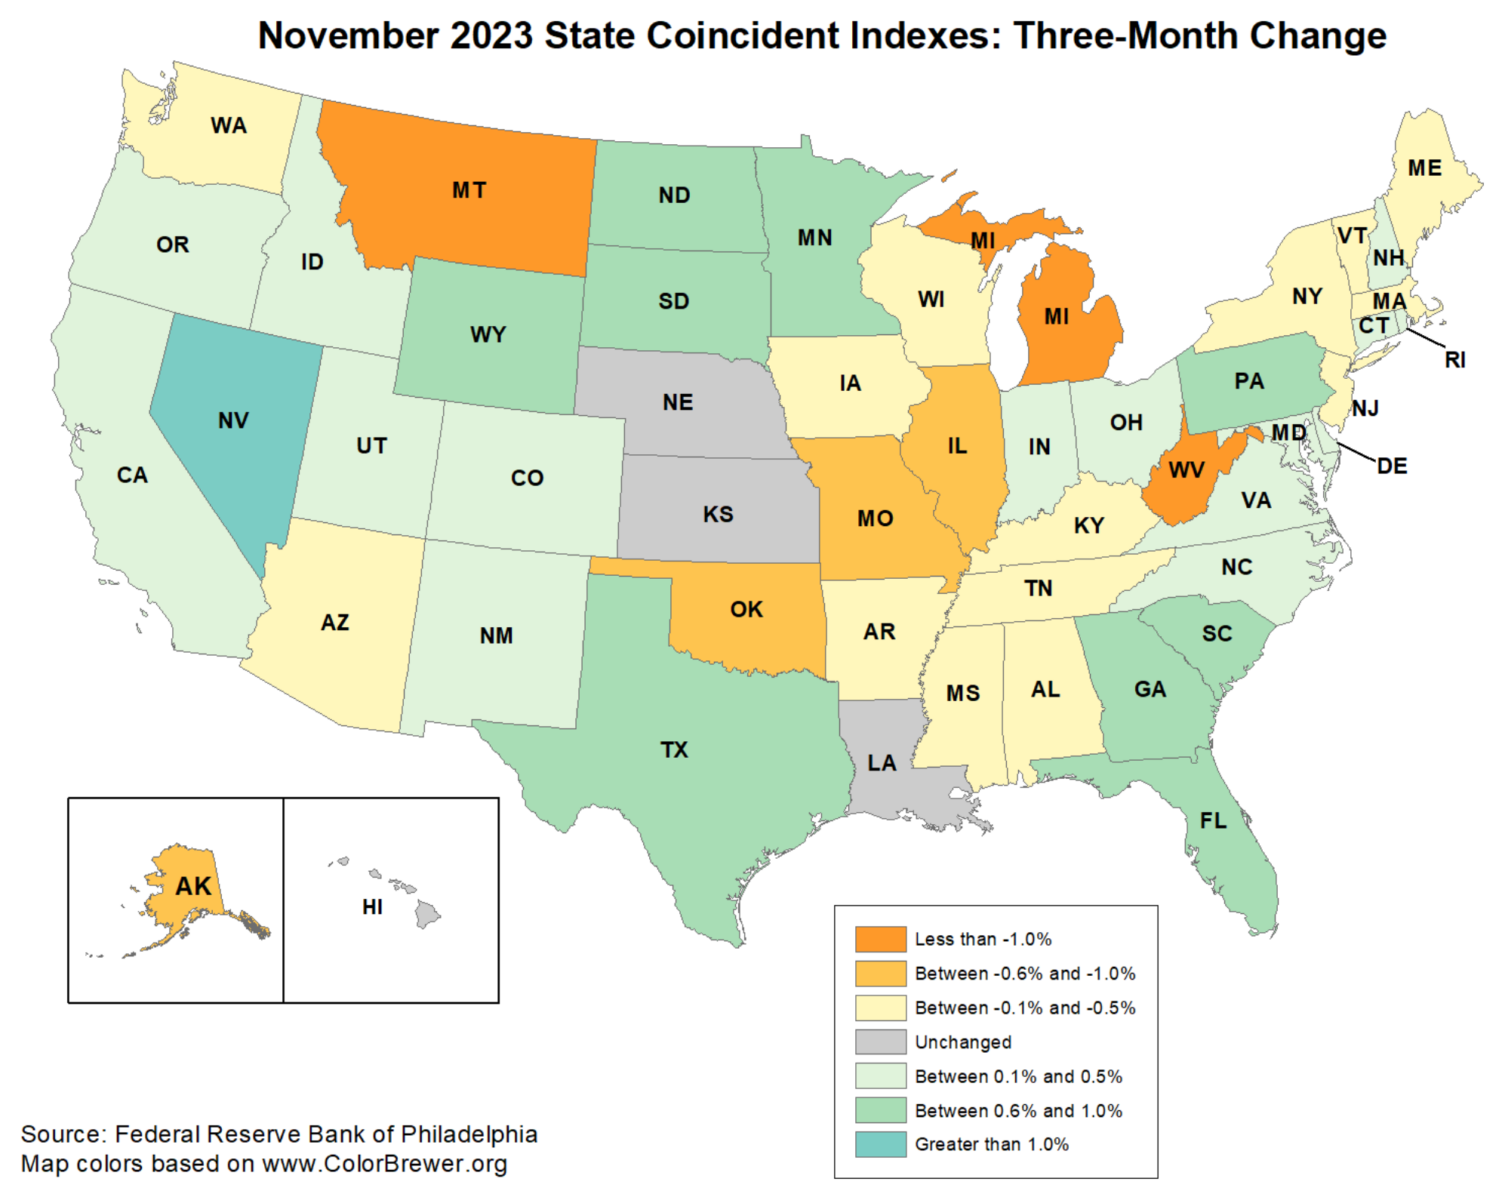
I am popping out of book leave to share this single data point that snuck out over the holidays: The Federal Reserve Bank of Philadelphia’s State Coincident Indicators for November 2023.
I like the SCI – its broad, consistent, and does not operate with too big of a lag.
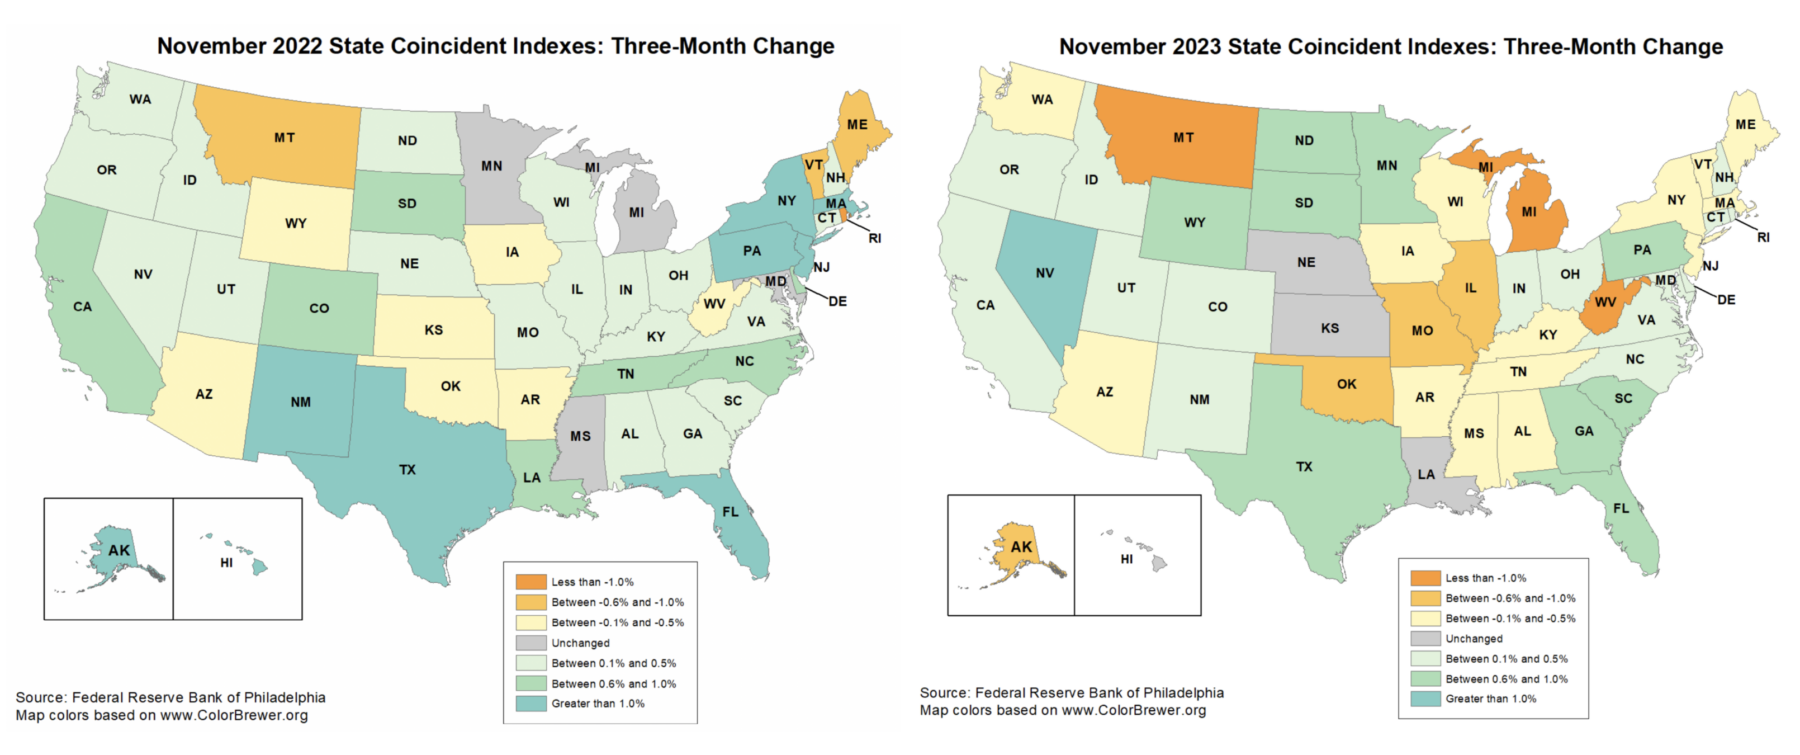
Over the past three months, the indexes increased in 25 states, decreased in 21 states, and remained stable in four, for a three-month diffusion index of 8. Compare this with the same period one year ago, when the coincident indexes increased in 30 states, decreased in 13 states, and remained stable in seven, for a one-month diffusion index of 34.
To greatly over-simplify the SCI: 8 more states are now contracting now (more orange/yellow) versus a year ago; 5 fewer states are expanding today (less blue/green) than same 3 month period in 2022:
State Coincident Indicators 1 Year Ago versus Today
I watch this to see how close we are to falling into a recession, and to get an idea of when the FOMC will be forced to recognize the impact of their open market interest rate handiwork.
This is a modest change, and likely not enough to push the Fed to act immediately. But if it gets much worse, it may force their hand. If this continues to decelerate, the FOMC might be cutting rates in the first half of the year. If November was a blip, and we see more expansion and less contraction, then it’s the back half of the year or later.
I’ll keep tracking this each month…
Source:
State Coincident Indexes: Release
The Federal Reserve Bank of Philadelphia, December 29, 2023
Previously:
State Coincident Indicators: November 2022 (January 4, 2023)
Signs of Softening (July 29, 2022)
Why Recessions Matter to Investors (July 11, 2022)
__________
1: The State Coincident Indicators are composed of four state-level variables: 1) Nonfarm payroll employment; 2) Average hours worked in manufacturing by production workers; 3) Unemployment rate; and 4) Wage and salary disbursements deflated by the consumer price index.


