The latest IRDA Claim Settlement Ratio 2024 was released on 28th Dec 2023. According to this, which is the best Life Insurance Company in 2024?
The majority of Life Insurance Companies nowadays lure buyers based on the IRDA Life Insurance Claim Settlement Ratio. However, is it the right data to look into?
What is the meaning of the Claim Settlement Ratio?
Claim Settlement Ratio is the indicator of how many death claims Life Insurance Company settled in any financial year. It is calculated as the total number of claims received against the total number of claims settled. Let us say, the Life Insurance Company received 100 claims and among those, it settled 98, then the claim settlement ratio is said to be 98%. The remaining 2% of claims the Life Insurance Company rejected.
Based on this, we can easily assume how customer-friendly they are in dealing with death claims. However, I warn you that this claim settlement ratio is raw data.
It will not give you a clear picture of what types of products they settled. They may be Endowment plans, ULIPs, or Term Insurance Plans. Hence, this is not the sole criterion in judging the performance of a life insurance company.
More than that we don’t know for what reasons the insurance company rejected the claims.
Some interesting facts from IRDA Annual Report 2023
# As per the Swiss Re Sigma Report, the insurance penetration of the Life Insurance sector in India is reduced from 3.2% in 2021-22 to 3% in 2022-23 and the same for the Non-Life Insurance sector remained at 1% in both these years. As such, India’s overall insurance penetration reduced to 4% in 2022-23 from the level of 4.2% in 2021-22.
# For new business, traditional products contributed Rs.6.77 lakh crore, constituting 86.59% of the total premium and the share of ULIPs stood at 13.41%. The business from traditional products grew by 14.40% and the same for ULIPs is 4.61%. This means people are still investing in traditional life insurance and ULIPs. Share of Term Life Insurance premium looks miniscule.
# Participation of women in buying life insurance – 30.13% in private insurers and 35.81% in public sector insurers.
# Out of the 24 life insurers in operation during 2022-23, 17 companies reported profits.
# IRDAI (Expenses of Management of Insurers transacting life insurance business) Regulations, 2016 prescribe the allowable limits of expenses of management taking into account, inter alia the type and nature of the product, premium paying term, and duration of insurance business. During the year 2022-23, out of 24 life insurers, 18 were compliant with the aforementioned regulations. Six life insurers had exceeded the limits of expenses on an overall basis or segmental basis and their request for forbearance is under examination.
# During 2022-23, life insurers paid a total amount of 42,322 crore as commission. The commission expenses ratio (commission expenses expressed as a percentage of premium) slightly increased to 5.41% in 2022-23 from 5.18% in 2021-22. However, total commission outgo increased by 17.93% (total premium growth 12.98%) during 2022-23 as compared to the previous year.
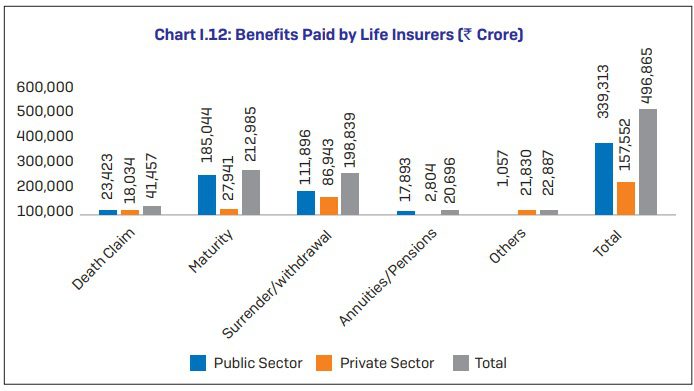
# Benefits paid by life insurers are as below.
# Grievances on Unfair Business Practices (UFBP ) registered against Life Insurers. You noticed that there is a decrease in complaints. However, not a great achievement.
# In the case of a source of business for life insurance, banks bring around 53% of business and individuals bring 23% of business for private sector insurers. For the public sector, 96% are from individuals and around 3% from banks. BEWARE!!
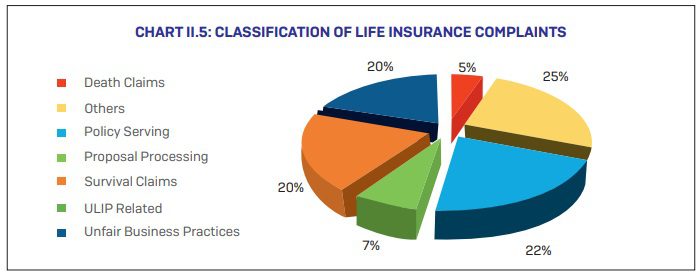
# Classification of Life Insurance Complaints are as below.
Noticed that the major chunk is related to policy serving and followed by unfair business practices. Death claim-related complaints are just around 5%.
Latest IRDA Claim Settlement Ratio 2024
Surprisingly, this year in its annual report, IRDA did not publish the individual life insurance companies’ claim settlement ratio. Instead, IRDA just published this below report. Hence, I am also forced to share the same. However, I just noticed that they are uploading the claim settlement ratio of life insurers in a different Excel sheet. But earlier years data is available but the latest data is missing.
Hence, as of now, I am sharing whatever the IRDA shared as a consolidated industry claim settlement ratio. As and when I get the individual companies’ data, I share the same here.
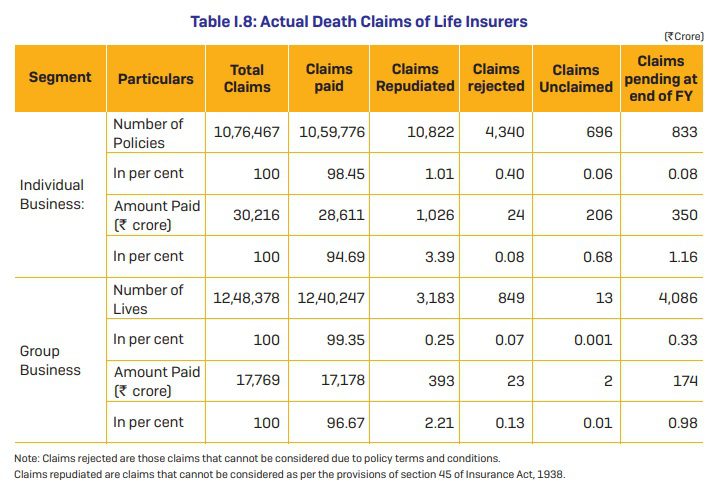
In the case of individual life insurance business, during the year 2022-23, out of the 10.76 lakh total death claims, the life insurance companies paid 10.60 lakh death claims, with a total benefit amount of 28,611 crore. The number of claims repudiated was 10,822 for an amount of Rs.1,026 crore and the number of claims rejected was Rs.4,340 for an amount of Rs.24 crore. The claims pending at the end of the year were Rs.833 for Rs.350 crore. The claim settlement ratio of the public sector insurer was 98.52% at
March 31, 2023, compared to 98.74 % as of March 31, 2022. The claim settlement ratio of private insurers was 98.02% during 2022-23 compared to 98.11% during the previous year. The industry’s settlement ratio decreased to 98.45% in 2022-23 from 98.64% in 2021-22.
Based on the above information, it is hard to judge individual companies performance. Even though the claim settlement ratio is not a major criterion for choosing an insurance company or product, I think by not providing the details like earlier annual reports, I felt it is hard to judge even the efficiency of the company in the settlement of claims. Because earlier annual reports were even used to classify the time taken to settle the claims.
For me, more than claim settlement, how much time each insurer took to settle the claim was vital (even though reasons for delay may be unknown to us).
Let us see if IRDA publishes this missing data separately. I will share that information once I get it.


