
Last week (February 15, 2024), the Japanese Cabinet Office released the latest national accounts estimates for the December-quarter 2023 – Quarterly Estimates of GDP for Oct.-Dec. 2023 (The First preliminary) – which showed that the economy had slipped into an official recession (two consecutive quarters of negative GDP growth) and in the process had moved from being the third largest economy in the world to become the fourth behind the US, China and Germany. According to the media release – 2023年10~12月期四半期別GDP速報 – the quarterly growth rate was -0.1 per cent (annual -0.4 per cent). Domestic demand was weak, contributing -0.3 per cent while net exports contributed +0.2 per cent. Part of the story is related to a ‘valuation drop’ because the yen has depreciated in recent months, undermining the value of exports and increasing the value of imports. But while there is some hysteria in the ‘markets’ and the mainstream economics commentary about the result, caution is required because the data will be revised (it was only preliminary) as more data comes in and it is highly possible for the negative to become a positive. But, I also take a different perspective on this from the dominant narrative in the media as you will see if you read on.
There is quite a deal of misunderstanding about the so-called ‘lost decade’ in Japan, following its dramatic real estate crash in the early 1990s.
The current narrative builds on those misunderstandings and constructs the GDP outcomes as if low growth is a problem.
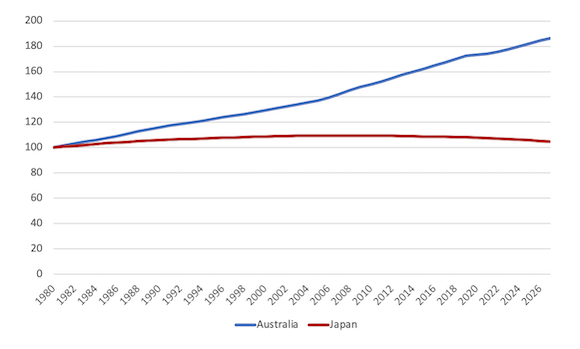
If you look at the next graph you will start to get the point.
It shows population growth for Australia and Japan indexed to 100 in 1980.
In 1980, the population of Australia was 14.8 million and by 2022 it was recorded at 25.9 million and the annual growth rate is about 1.6 per cent on average per year.
There was a slump in the population growth during the early years of the pandemic, as the government closed the external border and migration was highly restricted.
In stark contrast, Japan’s population is now shrinking slowly and there are projection that by 2025, the Japanese population will be around 121 million
The next graph comes Japan’s Statistical Office and provides a different perspective of the population situation in Japan over a longer period.
It is clear that the population in Japan is in decline and that decline is accelerating.
Japan has one of the world’s oldest populations, which is leading to a declining workforce and increased healthcare and pension expenses.
There are lots of practical aspects to this dynamic which the policy makers will have to address – for example, how to shift productive resources from servicing children to servicing the elderly.
The government will have to work on stimulating productivity growth (note: which is a separate concept to GDP growth) so that the shrinking workforce can increasingly provide the for the material needs of the growing retirement community, given that net inward migration is unlikely to relieve the shortages.
But the comparative population dynamics between Australia and Japan helps us put the claims about a ‘lost decade’ into a more meaningful perspective.
GDP per capita tells us how the size of the economy has moved in relation to the underlying population dynamics.
It is no surprise that most economies have growth in GDP terms faster than Japan over the last few decades given the divergences in population growth.
But how has GDP per capita evolved?
The following graph compares Australia to Japan from 1980 to 2022 (indexed to 100 in 1980).
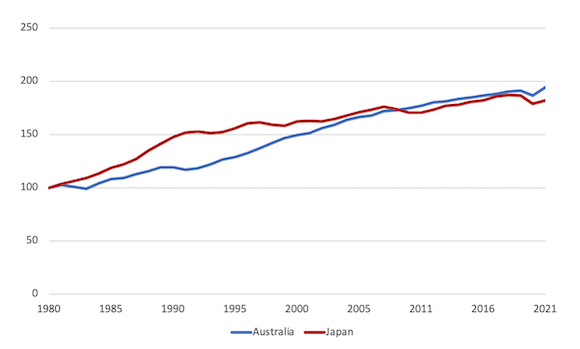
Prior to Japan’s asset crash in 1991, GDP per capita was growing much more quickly in that nation relative to Australia.
The 1991 crisis ended that period of increasing prosperity and GDP per capita increased slowly after that in Japan.
In the early 2000s, GDP per capita was growing almost at the same rate in both countries.
The Global Financial Crisis (GFC) was more damaging for Japan than it was for Australia, in part, because the government fiscal support was relatively larger in the latter.
We can also see evidence that the Japanese sales tax hike in May 1997 when household consumption growth slumped, and GDP declined.
The salient point though in the context of this comparative analysis, is that over the 40-year period, the evolution of GDP per capita in both countries does not justify categorising Japan as a failed economy, along the lines of the ‘lost decade’ narrative, while at the same time holding Australia out as a well-performed economy.
The next graph provides a comparison of the evolution of GDP per capita post pandemic (the data is indexed at 100 in 2020).
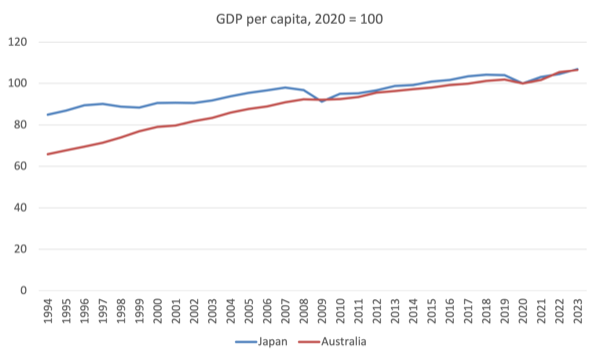
GDP per capita in Japan has grown by 7 per cent since 2020 to the end of 2023, while for Australia it has grown just 6.5 per cent (the last quarter of 2023 is estimated for Australia given the official data is not yet out).
However, the data for Japan includes the recent national accounts release which includes two negative GDP growth quarters (September and December).
If we conclude that the evolution of GDP per capita, which is an average measure, has been broadly similar over this period, then the next point of inquiry focuses on how national income has been distributed over the period.
If we consider the Gini coefficient measure, then Japan records a lower level of income inequality than Australia for comparable data.
The summation is that while GDP growth in Japan is very low, population growth is similarly low, which means that the nation can sustain stable or improving material standards of living.
Australia, by contrast, must record higher rates of GDP growth to maintain a similar time path for GDP per capita because its population growth is much higher.
Thus, discussions that focus on Japan’s low rate of GDP growth fail to understand the context of low population growth.
If Australia’s GDP growth fell to rates common in Japan over the last two decades or so, then its unemployment rate would rise significantly because the population growth, combined with productivity growth places a much higher real GDP growth requirement for the unemployment rate to remain stable.
In terms of productivity growth potential, I was examining some interesting data over the weekend which comes from the – Global Innovation Index 2023 – published by the Swiss-based World Intellectual Property Organization (WIPO).
We learn that:
In both 2021 and 2022, Asia was the dominant force behind PCT filings, accounting for 54.7 percent of all PCT applications filed in 2022, with China, Japan and
the Republic of Korea the strongest Asian international patent filers. In contrast, international patent filings from selected advanced economies, such as the United States (−0.6 percent) and the United Kingdom (−1.7 percent), underwent a decline.
The top S&T cluster (which are “the geographical areas around the world where the highest density of inventors and scientific authors are located”) was Tokyo-Yokohama (Japan) “followed by Shenzhen–Hong Kong–Guangzhou (China and Hong Kong, China), Seoul (Republic of Korea), Beijing (China) and Shanghai–Suzhou (China).”
The top applicant was Mitsubishi Electric and the top organisation was the University of Tokyo.
WIPO also provided this Appendix Table which shows ranks clusters by patent applications and scientific publications.
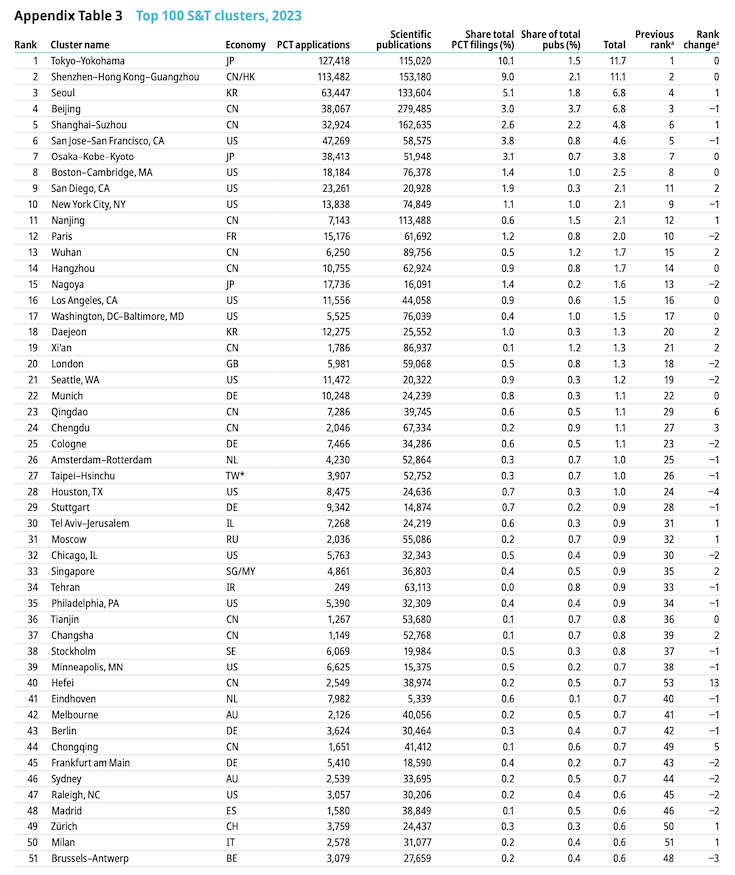
You can see that the Tokyo-Yokohama cluster accounts for 11.7 per cent of the total followed by the Shenzhen–Hong Kong–Guangzhou cluster in China (11.1 per cent of total).
Which means the top-ranked cluster is way ahead the other nations including the US.
Australia come in towards the bottom (Melbourne at 42/50 and Sydney 46/50) which reflects the moribund nature of our corporate sector that prefers to cheat workers to make profits or plunder public assets through privatisations rather than invest in R&D and innovate in new technologies.
The Global Innovation Index also provided an interesting graph (Figure 9 Years of life beyond 60), which I reproduce here.
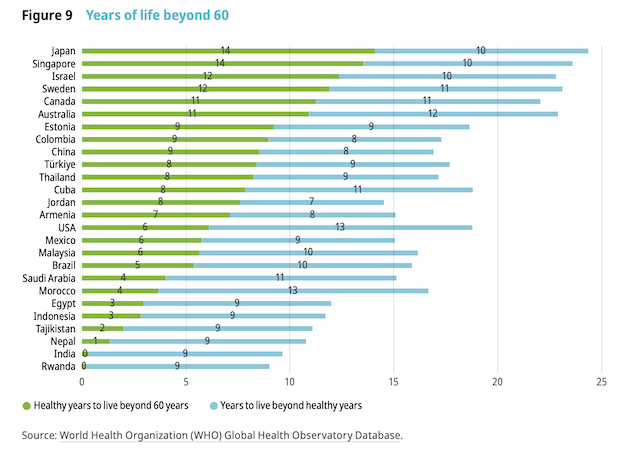
It notes that:
Healthy life expectancy beyond 60 years of age is longest in Japan, with an additional 14 years of healthy living plus a further 10 years of less healthy living
Degrowth potential
The ageing population in Japan has motivated commentators to construct the issue as a major problem facing government and all sorts of spurious remedies are advocated.
Clearly, the skill shortage scenario that is regularly rehearsed in the media is tied in with the ageing society debate, where advanced nations are facing so-called demographic ‘time bombs’, with fewer people of working age left to produce for an increasing number of people who no longer work.
The mainstream narrative paints these trends as major problems that have to be confronted by governments, and, typically, because of faulty understandings of the fiscal capacities of governments, propose deeply flawed solutions.
I see these challenges in a very different light.
Rather than construct the difficulties that firms might be facing attracting sufficient labour (the ‘skills shortages’ narrative), I prefer to see the situation as providing an indicator of the limits of economic activity or the space that nations have to implement a fairly immediate degrowth strategy.
I discussed that issue in this blog post – Degrowth, deep adaptation, and skills shortages – Part 4 (October 31, 2022).
I will be expanding on that in a new book that I hope to get out early 2025 in collaboration with my research colleagues at Kyoto University.
The point is that a low growth scenarios, where people are still well-off and living long lives with good health care and nutritional possibilities would appear to be better than pushing for high growth rates where people are unhappy and sick (I will report on some new data about that soon).
All of which is reinforced by the global emergency to reduce our demand on the world’s resources and decarbonise our economies.
Japan will need less output because it will have less people.
The policy challenge is to manage that transition rather than declare more growth is needed.
Conclusion
I will write more about how degrowth can unfold in Japan while still maintain the integrity of the society.
That is enough for today!
(c) Copyright 2024 William Mitchell. All Rights Reserved.
