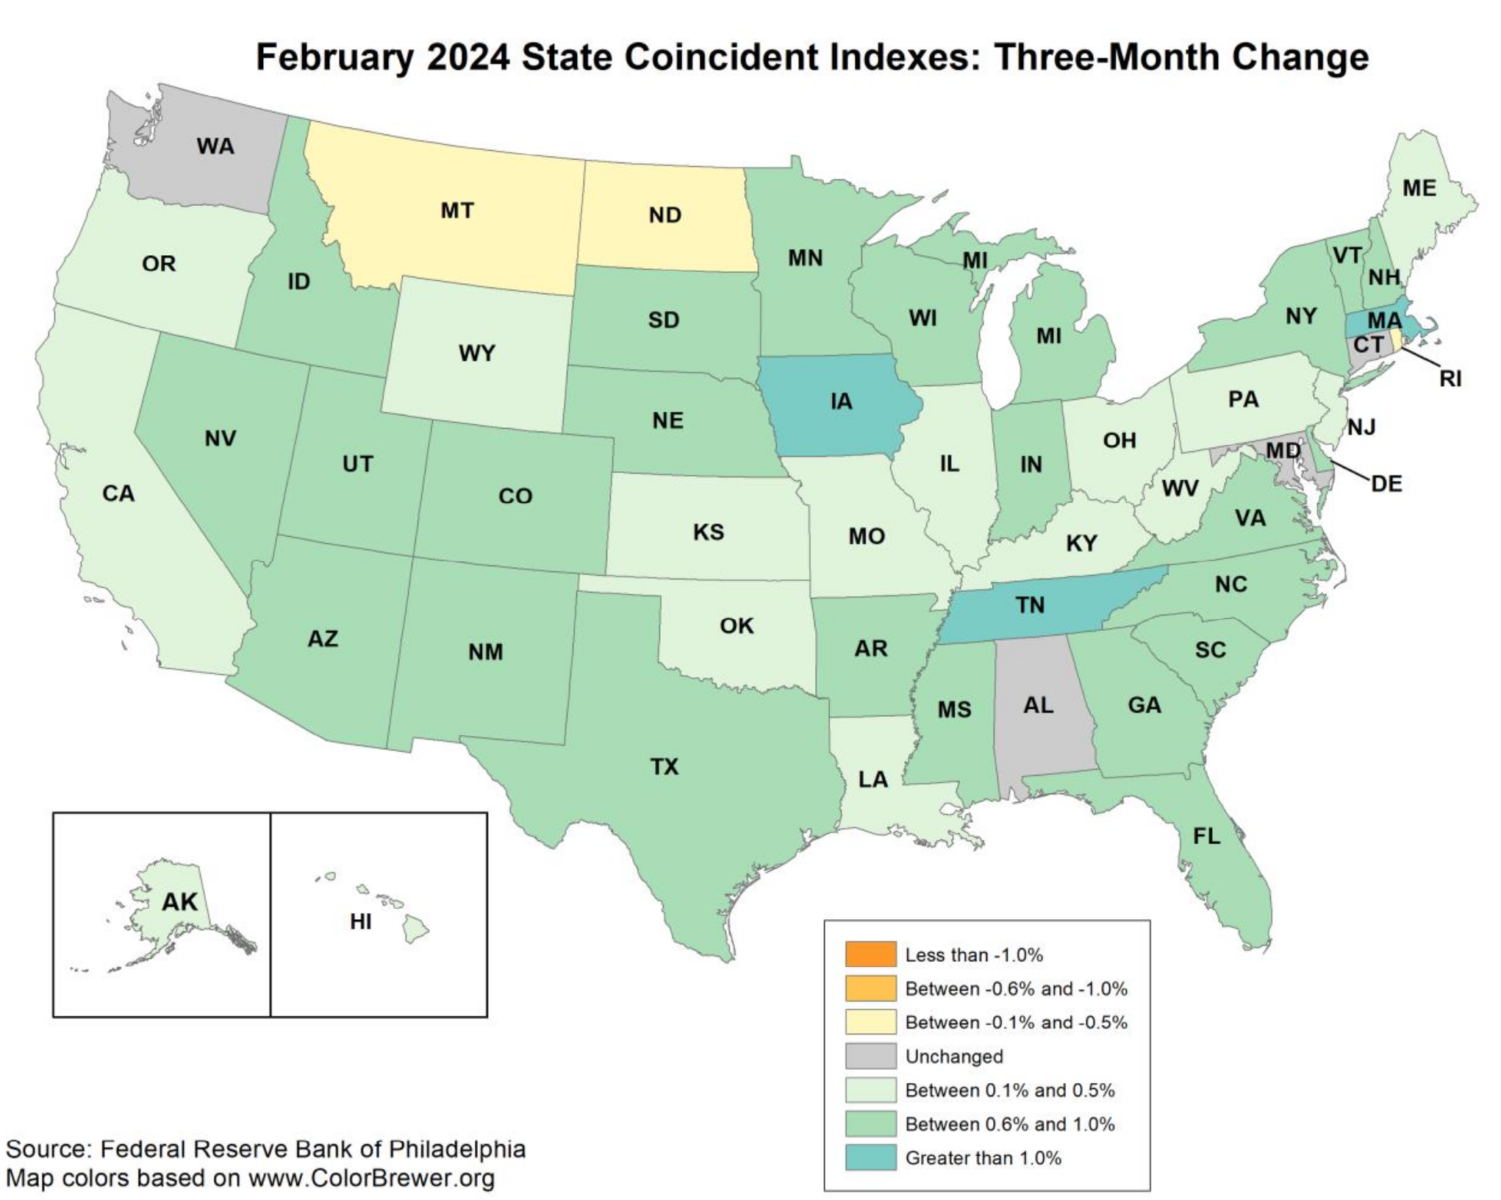
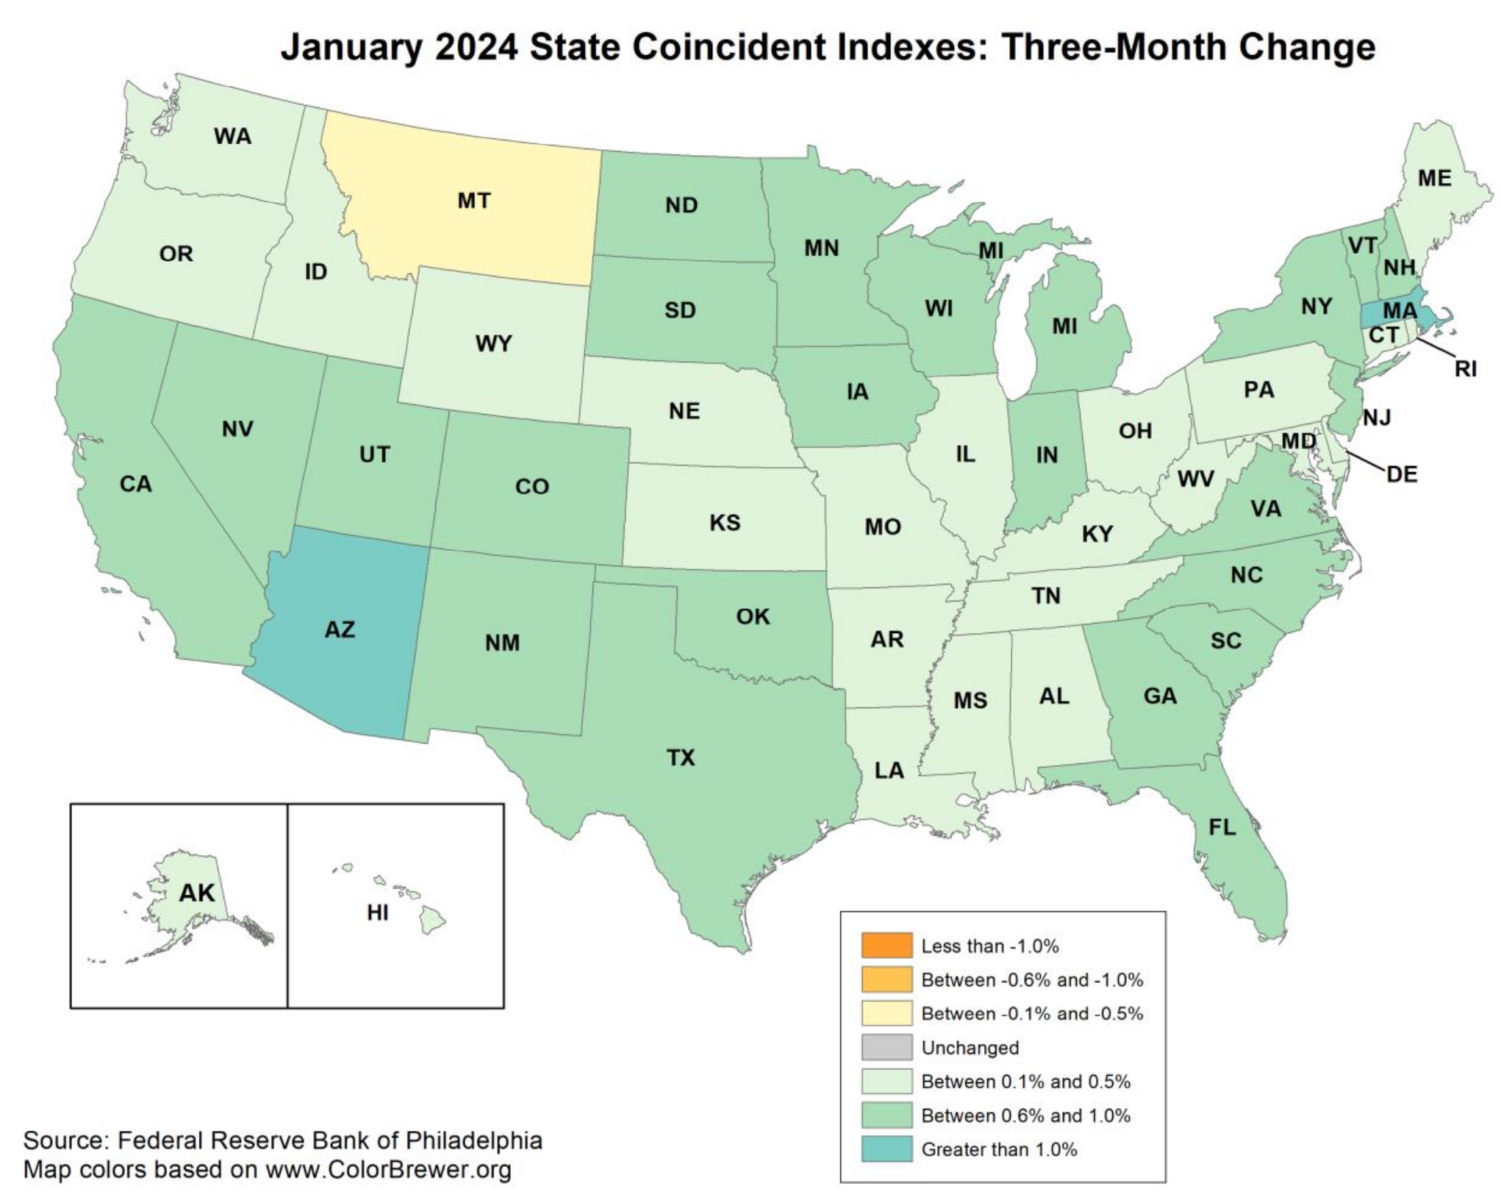
Between book leave and COVID I have been pretty quiet lately. Since it’s been a few months, I thought we could take a quick look at the Federal Reserve Bank of Philadelphia’s State Coincident Indicators out for both January and February 2024.1
As the charts above show, the economy on a state-by-state basis has markedly improved from Q4 2023’s softening. I would go as far as to suggest it is robust.
In January, the 3-month average of “the indexes increased in 49 states and decreased in one state, for a three-month diffusion index of 96.” In February, the 3-month average “increased in 43 states, decreased in three states, and remained stable in four, for a three-month.” The 12-month change is +2.9%
Note in November 2023, the indexes only increased in 25 states.
The expectations of a recession continue to be belied by strong growth in the majority of states, powered by hiring, wage gains, and consumer spending,..
Sources:
State Coincident Indexes: Release
The Federal Reserve Bank of Philadelphia, January/February 2024
Previously:
State Coincident Indicators Slipping (January 2, 2024)
State Coincident Indicators: November 2022 (January 4, 2023)
Signs of Softening (July 29, 2022)
Why Recessions Matter to Investors (July 11, 2022)
__________
1. The State Coincident Indicators are composed of four state-level variables: 1) Nonfarm payroll employment; 2) Average hours worked in manufacturing by production workers; 3) Unemployment rate; and 4) Wage and salary disbursements deflated by the consumer price index.


