Let us do the Parag Parikh Flexi Cap Fund Review 2024. How has the fund performed since its inception from 2013 to now compared to its benchmark Nifty 500 TRI?
Among active funds, I too recommended this fund for “Top 10 Best SIP Mutual Funds To Invest In India In 2024“. Hence, I thought let us review this fund.
History of Parag Parikh Flexi Cap Fund
The earlier name of Parag Parikh Flexi Cap Fund was Parag Parikh Long Term Equity Fund. This fund was launched on 28th May 2013. During the launch, the benchmark was CNX 500. Now it is Nifty 500 TRI. The expense ratio of the fund when launched was 2% for direct funds. The current expense ratio is 0.56%. The current AUM of this fund is Rs.58,900.51 Crore.
The change in name happened mainly because of the SEBI reclassification of the funds. The standard deviation of the fund is currently at 11.34%. Portfolio turnover for equity portfolio (including arbitrage position) is 29.7%.
The domestic equity portion of the scheme will be managed by Mr. Rajeev Thakkar (he has been a fund manager since inception) and Mr. Rukun Tarachandani, while Raunak Onkar manages the foreign investment component. Raj Mehta is responsible for the ‘fixed income’ investment component.
Who can invest in the Parag Parikh Flexi Cap Fund?
Why I like this fund house is mainly for the clarity of data and disclosure available on their website. We no need to look for another website for data churning or to get clarity. One such information is disclosure of who can invest and who can’t invest in this fund.
The wordings explained are as below.
“This scheme is only suitable for ‘true’ long-term investors….
However, if you are an investor:
- Who knows the perils involved in instant gratification
- For whom the term ‘long term’ means a minimum period of five years.
- Who gets excited rather than repelled, when stock prices and valuations are low.
- For whom purchasing a stock is no different from purchasing a business.
Then we urge you to partner with us, as this scheme has been designed with you in mind.
We will follow a simple (though not simplistic) investment process. As we will not pay mere lip service to value investing, it may mean that often we will be purchasing businesses that are going through a painful phase and are therefore unloved. Each of them will blossom at different points and that is why, there may be extended periods when you may feel that ‘nothing is happening’. While some may regard us as boring, we are adamant that we will never sacrifice prudence for the sake of providing excitement.
Also, the fund managers will attempt to profit from various cognitive and emotional biases displayed by companies and market participants. In other words, along with the dissection of financial statements, there will also be an overlay of the study of human emotions.
Also, having strong conviction in the principle of compounding, we will offer our investors only the ‘Growth Option” and not the ‘Dividend Option’.
This scheme is not for you if…
- You track mutual fund Net Asset Values every day.
- To you, the term ‘Long Term” is merely a year or two.
- You believe that investing should be ‘exciting’
- You fear, rather than welcome, stock market volatility
- You believe you have the ability to time the market
- You are impressed by fund managers who profess to be magicians
- You prefer complex mutual fund products to simple ones.
- You depend on periodic income in the form of mutual fund dividends
This gives more clarity of whether you have to consider this fund or not.
Current Portfolio Of Parag Parikh Flexi Cap Fund
Currently, the fund is holding around 71.66% in equity, 0.64% in equity arbitrage, overseas stocks of 15.39%, and Debt and Money Market instruments of 9.28% (inclusive of CDs, T Bills, and CPs). The current cash and cash equivalent holding is 8.94%.
Sectorwise exposure of this fund is – Banking – 19.61%, IT – 12%, Finance – 7.3%, IT Software – 7.3%, and Capital Markets – 7.24%.
Parag Parikh Flexi Cap Fund Review 2024
Let us move on to understand the performance metrics of this fund. As I mentioned above, the AMC website clearly discloses the performance metrics and hence it is easy for anyone to judge and no brainer is required here. However, I thought to use my own data crunching as the PPFAS website shows data only for regular fund NAV. Hence, I used the data of direct fund NAV and tried my best to look into the performance.
As the fund launched on 28th May 2013, we have around 2,700+ daily data points to do our research with the corresponding Nifty 500 TRI Index
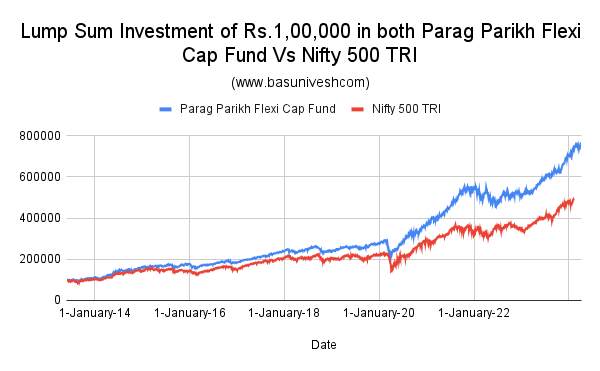
What if someone invested Rs.1 lakh in Parag Parikh Flexi Cap Fund Vs Nifty 500 TRI?
If someone invested Rs.1 lakh on the launch date of 28th May 2013 in both Parag Parikh Flexi Cap Fund and Nifty 500 TRI, then the result is as below.
You noticed the wide outperformance post-2020 market crash between Parag Parikh Flexi Cap Fund and Nifty 500 TRI. The final values are Rs.7,67,347 for Parag Parikh Flexi Cap Fund and Rs.4,92,214. Almost around 35% return difference!! However, let us not judge with this lump sum movement.
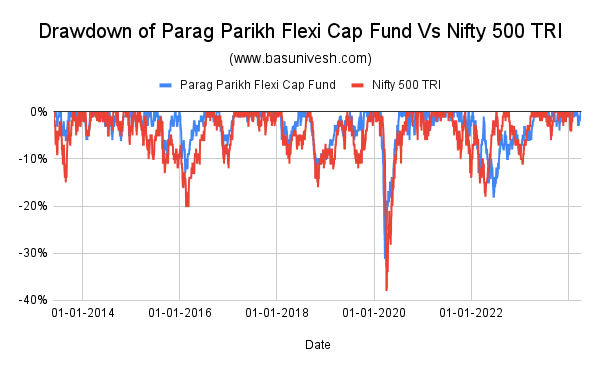
Drawdown of Parag Parikh Flexi Cap Fund Vs Nifty 500 TRI
This is a measure of how much the Parag Parikh Flexi Cap Fund and Nifty 500 TRI have fallen from all-time previous highs.
You noticed that up to the 2020 period, the fund has a fantastic drawdown compared to the Index. However, the same is not managed post-2020. A slightly higher drawdown has been visible in recent years. This is a little bit of a concern. Otherwise, the fund has a lower drawdown compared to the benchmark.
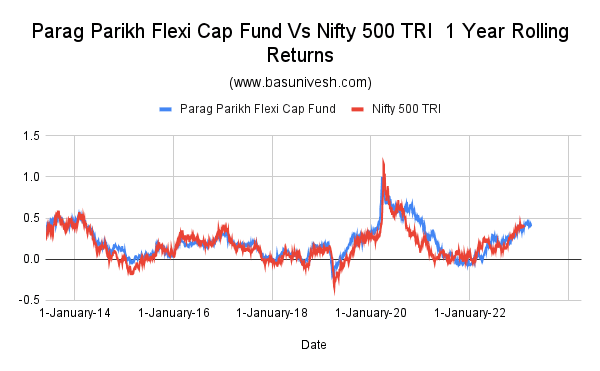
Parag Parikh Flexi Cap Fund Vs Nifty 500 TRI 1 Year Rolling Returns
Let us now move on to the understanding of rolling returns. Hence, let us start with 1-year rolling returns.
You noticed that for many periods, the fund has outperformed the index.
Fund Average Returns – 21.3% and Benchmark Average Returns – 16.6%
Fund Max Returns – 100% and Benchmark Max Returns – 100%
Fund Min Returns – -17.6% and Benchmark Max Returns – -30.3%
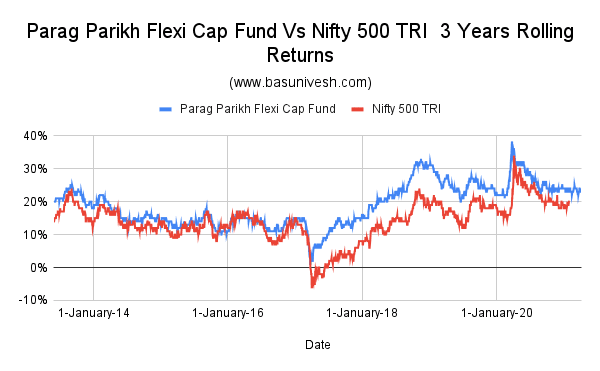
Parag Parikh Flexi Cap Fund Vs Nifty 500 TRI 3 Years Rolling Returns
Let us look into the 3 years rolling returns performance.
For the 3-year rolling returns period, the fund is doing fantastically compared to the benchmark for many years.
Fund Average Returns – 18.9% and Benchmark Average Returns – 14.2%
Fund Max Returns – 37.6% and Benchmark Max Returns – 33.5%
Fund Min Returns – 0.74% and Benchmark Max Returns – -6.3%
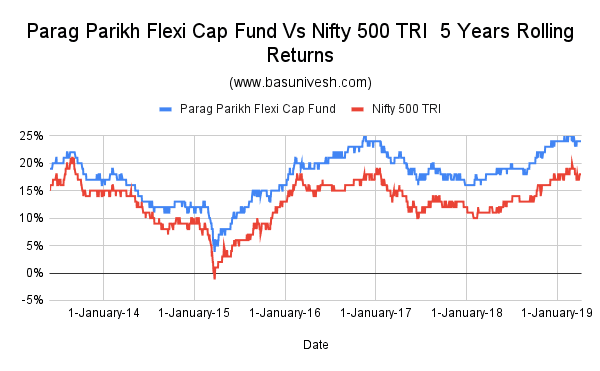
Parag Parikh Flexi Cap Fund Vs Nifty 500 TRI 5 Years Rolling Returns
Let us now compare the 5-year rolling returns results.
For 5-year rolling periods also, you can easily visualize the fund’s outperformance to its benchmark.
Fund Average Returns – 17.6% and Benchmark Average Returns – 12.7%
Fund Max Returns – 25% and Benchmark Max Returns – 21.1%
Fund Min Returns – 4.09% and Benchmark Max Returns – -1.06%
I skipped comparing 10-year rolling returns as we don’t have that much of data points.
Conclusion – Overall the fund has performed fantastically since launch. However, do remember that this is an active fund. Hence, in the future, if the fund underperforms, then you must not be surprised. Also, one of more biggest risks is too much reliance on the fund manager Mr. Rajeev Thakkar. If he moves out then the interesting thing to notice is how it will perform. Such risks are always there when you choose the active funds. One more reason for its spectacular performance may be due to its overseas stock holding.


