
I haven’t much time free today and with the federal government’s fiscal statement coming out tomorrow night and wage data and the labour force data coming out Wednesday and Thursday, respectively, it is going to be a full week. Given I am using all my time to finish the manuscript for my next book which has to be delivered to the publisher on June 1, I am writing very little here today. But there was some interesting data released by the Australian Bureau of Statistics (ABS) last week that bears on my general theme of degrowth, in a roundabout sort of way. The data from the – National Health Survey 2022 – is very revealing and shows how far people will have to go to adopt degrowth behaviours at a personal level. And just so you know, while I wrote about health matters last week and will again today, I don’t intend to make it a regular habit on a Monday.
Related posts
1. Degrowth, food loss and food waste – Part 7 (February 20, 2023).
2. Moving to a sustainable system of food production within a degrowth paradigm (February 1, 2024).
3. The obesity epidemic – massive daily losses incurred while the policy response is insufficient (October 21, 2019).
Australian National Health Survey
Tbe ABS tell us that:
The National Health Survey (NHS) 2022 is the most recent in a series of Australia-wide health surveys. It is designed to collect a wide range of information about the health of Australians, including:
– Prevalence of health conditions
– Prevalence of health risk factors (such as smoking and vaping, alcohol consumption, and physical activity)
– Demographic and socioeconomic characteristics.
The data provides an exceptional window in the state of the human condition in Australia.
In this post, I will concentrate on two aspects, which are of most interest to me.
Physical activity
It doesn’t take much detective work to uncover the source of the health malaise.
The data on physical activity is rather stunning.
The Australian Institute of Health and Welfare discuss the guidelines for assessing – Physical Activity – which they define, unsrurprisingly as “any bodily movement produced by skeletal muscles that requires energy expenditure, following World Health Organisation definitions.
They tell us that:
Low levels of physical activity are a major risk factor for chronic conditions. People who are not active enough have a greater risk of developing cardiovascular disease, type 2 diabetes, osteoporosis and dementia. Being physically active improves mental and musculoskeletal health and reduces other risk factors such as overweight and obesity, high blood pressure and high blood cholesterol.
The guidelines come from the Federal Department of Health and Aged Care – Physical activity and exercise guidelines for all Australian – and, in part, “outline how much physical activity you should do …”
They are tailored by age and/or condition (such as pregnancy).
They provide a list of scientific studies to support the guidelines – Collection of evidence to inform Australia’s physical activity and sedentary behaviour guidelines.
So for an Adult these are the guidelines:
What exactly do they mean by ‘moderate activities’?
According to the scientific studies, it mean:
… at an intensity which requires some effort, but allow a conversation to be held. Examples include brisk walking, gentle swimming, social tennis, etc. Energy expenditure is 3.0 – 5.9 METs.
A MET is the Metabolic Equivalent and “One MET is defined as energy expenditure at rest, usually equivalent to 3.5mL of oxygen uptake per kg per minute.”
Vigorous activity will “make you breathe harder or puff and pant (depending on fitness). Examples include aerobics, jogging and some competitive sports. Energy expenditure is ≥6 METs.”
You might be excused for concluding that to meet these guidelines one doesn’t have to do very much physical activity at all.
Which was the conclusion I drew.
So how do Australians fare in terms of these guidelines?
Answer: Appallingly.
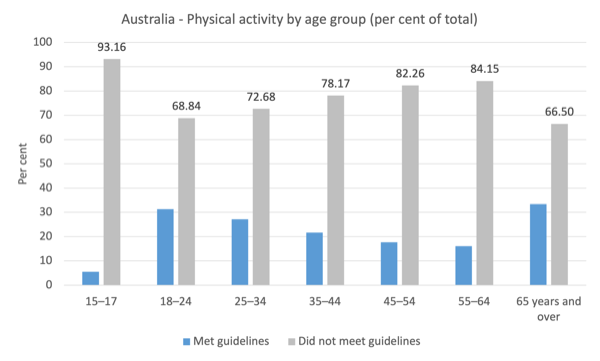
Here are the proportions by age cohort who do and do not meet the guidelines.
So 93.2 per cent of 15-17 year olds fail to meet the minimum standards.
I guess they are thumb twiddling a lot on their iPhones which is some activity.
We get a bit more active as we age but still not much at all.
By the way, while I had a fair idea of the situation, I was actually amazed when I saw this data and worked out how bad the situation is.
It is an indictment of the parents of our nation who are failing to ingrain habits in their teenage children.
The irony is that Australia claims to be a ‘sporting nation’ which, given this data, means we watch sport a lot while sitting on our tails.
I go to the football a lot and the spectators combine watching the game with an advanced rate of energy ingestion in the form of alcohol, pies, pastries, chips and chocolate bars, which I guess is the story here.
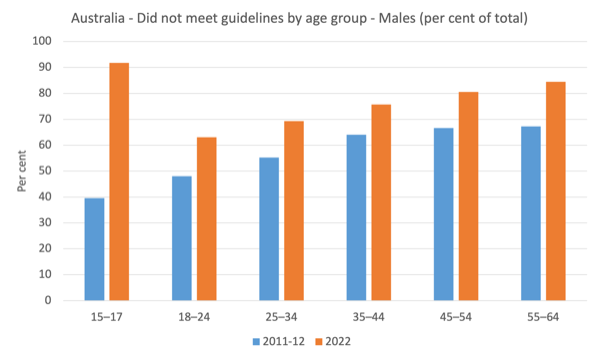
And while males are more physically active than females across almost every age group, they are still basically inert as the next graph shows.

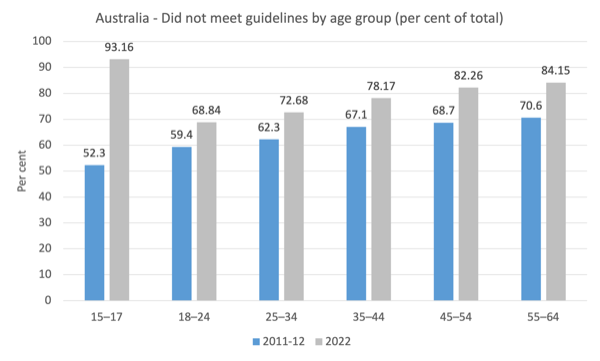
It is hard to compare the data across time because the initial NHS for 2011-12 categorised physical activity in a different way (Sedentary, Low, Moderate, High).
But if we assumed that the cohort that didn’t meet the 2014 guidelines (which are the current benchmark) were in the Sedentary and Low groups then we have this graph, which compares the 2011-12 results with the latest 2022 results for those who do not meet the guidelines.
As is obvious, in the space of a decade, the Australian population has gone from being relatively inert to very inert – a staggering deterioration in physical output.
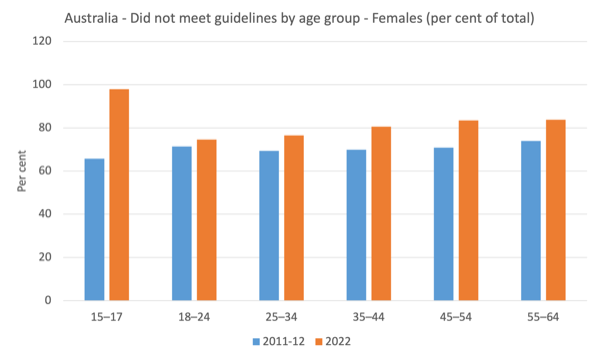
And the deterioration for males (next graph) is much more obvious than it is for females (the following graph).
The consequences
This deterioration in expenditure of physical energy and the overall lack of physical exercise in Australia clearly has health-related consequences.
The NHS output provides detailed data on “Body Mass Index, waist circumference, height and weight, by age and sex”.
The NHS uses WHO guidelines on – Obesity and Overweight.
The WHO say that in 2022:
– 1 in 8 people were obese in the world.
– Adult obesity has doubled since 1990, while adolescent obesity has quadrupled.
The WHO notes that:
Overweight is a condition of excessive fat deposits.
Obesity is a chronic complex disease defined by excessive fat deposits that can impair health. Obesity can lead to increased risk of type 2 diabetes and heart disease, it can affect bone health and reproduction, it increases the risk of certain cancers. Obesity influences the quality of living, such as sleeping or moving.
The WHO says that:
Overweight and obesity result from an imbalance of energy intake (diet) and energy expenditure (physical activity).
There are a lot of factors that drive such an imbalance – the WHO says that “obesity is a multifactorial disease’ – that relate to environment the person is in, “psycho-social factors and genetic variants”.
Obesity is more likely where there are limits on the “healthy sustainable food at locally affordable prices, lack of safe and easy physical mobility” among other things.
These factors would not in my view be a major issue for Australian residents.
But I am not reporting the scientific studies here so I won’t offer any more views on the distribution of factors that are causing the issue.
However, the lack of physical exercise for whatever reason must be a significant factor.
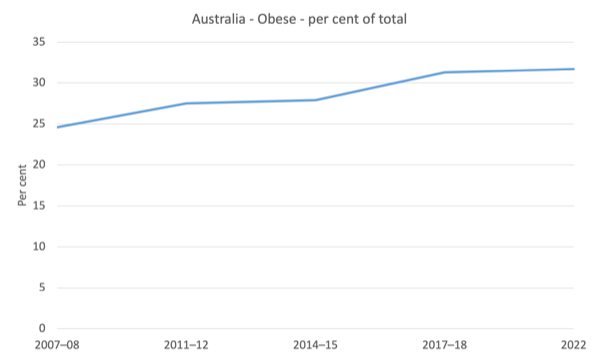
The first graph shows the proportion of Australians that the NHS classified as being Obese from 2007-08 to 2022.
The proportion is rising – 24.6 per cent in 2007-08 to 31.7 per cent in 2022.
The total of overweight and obese has risen from 61.2 per cent in 2007-08 to 65.8 per cent in 2022.
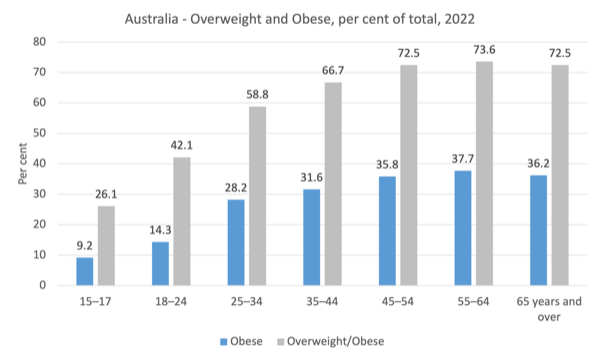
In terms of the latest 2022 data by age and sex the following graphs tell the story.
This graph shows the total proportions of obese and the sum of the obese and overweight people by age in 2022.
So nearly 40 per cent of Australian adults are clinically obese, which I consider to be an astounding figure and should prompt emergency policy action, which is non-existent.
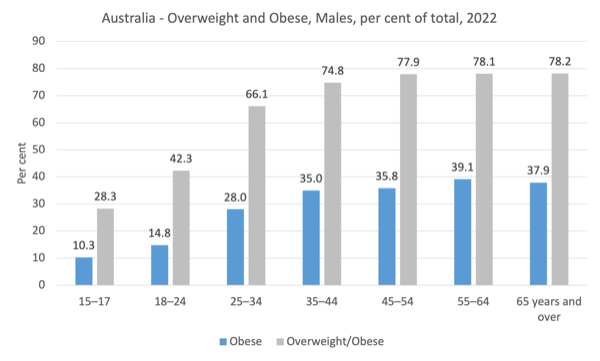
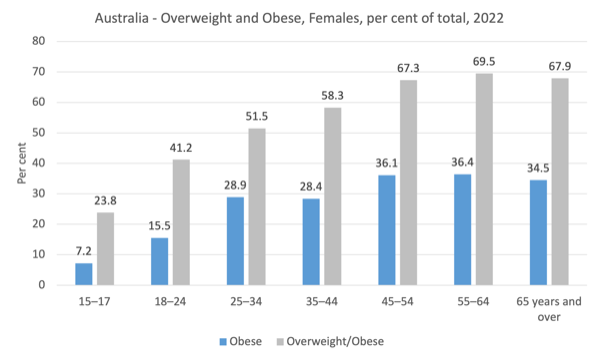
The next graphs show the same data for Males and Females, respectively as at 2022.
The data show that males are more obese than females and more overweight.
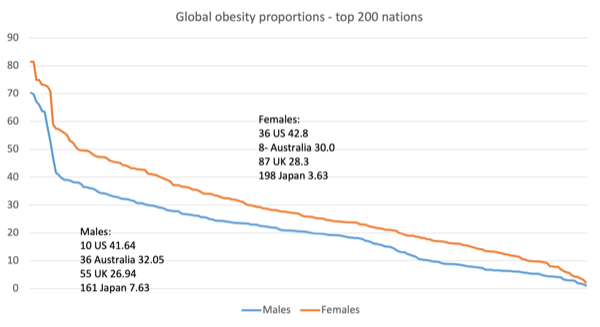
How does Australia compare with the rest of the world?
The Global Obesity Observatory provides comparative data and you can download the Adult dataset – Ranking (% obesity by country), adults.
The following graph summarises the data for males and females with some rankings, proportion by sex.
What has this got to do with Degrowth?
While most green oriented commentary is about reducing energy used in industry, transport and the like, it should also discuss the use of energy in the form of food and drinks ingested.
Clearly, a degrowth strategy will require a massive behavoural shift in our production and consumption patterns to reduce energy use.
Obesity arises from excess energy being taken in to our bodies.
That means that too much food is being eaten and where production cannot be shared on a global scale it also means excessive production in the wealthier nations.
At the personal level, then, degrowth will require than many of us eat and drink less – which will not only reduce our command of resources but will make us healthier.
I would note that I understand some of these health conditions are genetic and not discretionary and that qualifies my case here.
But a significant proportion of the obese ranks is due to volition and that is where a ‘personal degrowth’ strategy can begin.
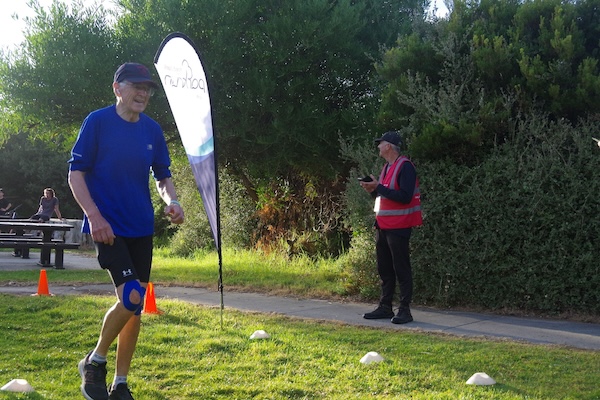
My effort to meet the physical exercise guidelines
And here is yours truly working to meet the physical activity guidelines as I cross the finish line at the Inverloch Parkrun down on the Victorian coast recently.
I try to get to the Saturday morning Parkrun if I can make it, wherever I am located (last weekend I did the Stockton Parkrun near Newcastle).
I can recommend Parkrun as a good way to exercise – you can run fast, run slower, walk and talk – with all ages without too much corporate takeover of your recreational activities.
Advance orders for my new book are now available
I am in the final stages of completing my new book, which is co-authored by Warren Mosler.
The book will be titled: Modern Monetary Theory: Bill and Warren’s Excellent Adventure.

The description of the contents is:
In this book, William Mitchell and Warren Mosler, original proponents of what’s come to be known as Modern Monetary Theory (MMT), discuss their perspectives about how MMT has evolved over the last 30 years,
In a delightful, entertaining, and informative way, Bill and Warren reminisce about how, from vastly different backgrounds, they came together to develop MMT. They consider the history and personalities of the MMT community, including anecdotal discussions of various academics who took up MMT and who have gone off in their own directions that depart from MMT’s core logic.
A very much needed book that provides the reader with a fundamental understanding of the original logic behind ‘The MMT Money Story’ including the role of coercive taxation, the source of unemployment, the source of the price level, and the imperative of the Job Guarantee as the essence of a progressive society – the essence of Bill and Warren’s excellent adventure.
The introduction is written by British academic Phil Armstrong.
You can find more information about the book from the publishers page – HERE.
It will be published on July 15, 2024 but you can pre-order a copy to make sure you are part of the first print run by E-mailing: info@lolabooks.eu
The special pre-order price will be a cheap €14.00 (VAT included).
That is enough for today!
(c) Copyright 2024 William Mitchell. All Rights Reserved.
