

Introduction: “Can you improve the returns of this endowment portfolio?”
In late 2022, I became a trustee of a private school endowment and was asked to join the investment committee. The committee consisted of a dedicated group of trustees with prudent investment sense. Although there were no permanent employees to manage the investment, a number of decisions had made the job manageable. The endowment worked with a sharp financial fiduciary who advised and then carried out the committee’s decisions.
Broadly speaking, the endowment had followed David Swensen’s Yale public model. Market timing and stock picking were completely avoided. Asset Allocation, or the practice of selecting deep, broad, major asset classes was the modus operandi. The portfolio was made up of Vanguard funds invested in the Total US Equity Market, International Equities, Emerging Market Equities, Public REITS, and the Bond Market Index Portfolio. Choosing passive Vanguard funds in major asset classes kept the expenses low, made monitoring easy, and allowed the portfolio to benefit from the gradual grind-up in most assets over time. Sure, there were drawdowns when markets had a tantrum, but staying on course by not market timing avoided any panic decisions.
In addition, every two months, the financial intermediary would rebalance the portfolio and take advantage of sharp selloffs or rallies across asset classes by buying the dips and selling the rips. The portfolio was thus brought to the target allocation.
The chair of the endowment pulled me aside and said, “You write for the Mutual Fund Observer! Is there anything you would recommend we do differently to generate higher returns?”
Allocation across asset classes: I Spy a high allocation to international equities!
Roughly, the portfolio was split up into these weights:
| US Stock & some REITS | US Bond | International Stocks | EM Stock | Private REITS & Private Credit | Cash |
| 46.0% | 25.0% | 18.2% | 4.5% | 3.2% | 3.1% |
Instinctively, 18.2% for International Developed Market Stocks, tracking the MSCI EAFE Index benchmark, felt too high. (MSCI EAFE translates to Morgan Stanley Capital International Europe, Australasia, and Far East Index.) I had started with a 15% weight to this category in my own portfolio but in the last few years brought it down to 4%.
Anyone who has read David Swensen’s phenomenal book on investing, Unconventional Success (2005) has read the table he suggested as an example of asset allocation. This table had International Equities at 15% and since then, people think that the 15% number is written in stone. It’s not. Swensen’s advice was to figure out what portfolio best suits the institution’s strengths, other assets, and future liabilities. In any case, I had started, like others with the 15% allocation to international developed market equities around 2016.
Since then, I had been surprised by the lower returns generated by International stocks. I had convinced myself that it just meant there would be higher returns in the following years. But those higher returns never came (at least the passive international benchmark did not bring high returns). I had wondered why there was a return deficit.
I only had to ask because I soon found a plethora of reasons to avoid international stocks. Goldman Sachs’s Private Wealth Management has been running a long-standing theme on US Preeminence since 2009 which laid out neatly how US stocks were going to beat the pants off their international counterparts.
International stock indices had lower weighting in tech stocks (compared to the US). A higher weighting in banks and commodities. And therefore, while international indices looked very cheap on the surface, when adjusted for sector weights and compared to the US market, most of its cheapness went away.
In other words, if the Total US Stock market had the same weight across sectors as the international index, the US stock market would also look like it has a lower PE multiple.
There were other reasons to avoid international stocks. In the 1980s and ’90s, there were many currencies, and each Central Bank decided interest rate and FX policy to suit their local economies. But by the 2010s and 2020s, with the advent of the Euro, and an almost coordinated global central bank interest rate policy, the economic cycles had merged. If the US went down, so did Europe and Japan. There was little divergence in the direction of how economies fared, only scales of magnitude differed. In such a world, there is less diversification.
US companies also have a much bigger pool of managerial talent to pick from. US corporate management is more shareholder-focused. And, in the present age, a large number (perhaps, a quarter) of US companies’ revenues come from foreign countries.
These qualitative reasons were sufficient for me to admit that my 15% was too high and perhaps 5% was a better allocation to international stocks. I thought the same would apply to the endowment portfolio. Besides making these subjective points, I showed two charts to the investment committee.
10-year Total Returns from 2013-2022
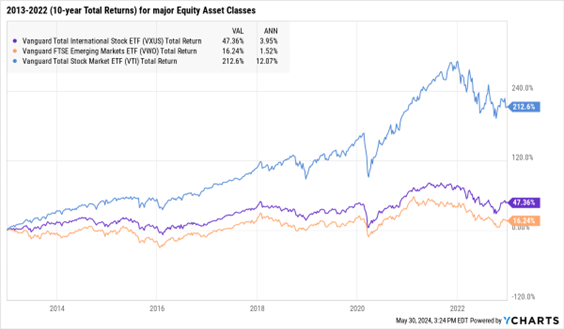
While US equities returned 12% annualized in the 10 years from 2013 to 2022, international stocks returned 4%, and emerging markets 1.5% per annum.
Taking the chart back to 1996, showed 9.6% for the US, 4.9% for international, and 5.5% for emerging stocks.
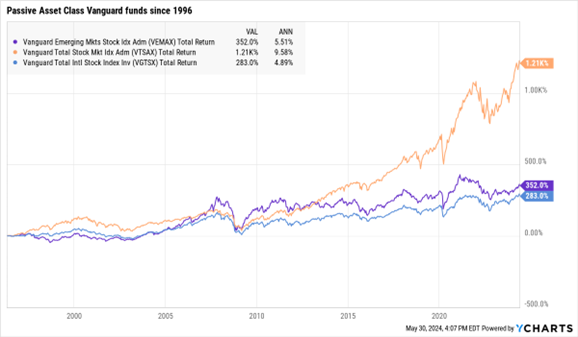
Looking at the data, I argued that the natural rate of return for International Developed stocks seems to be around 5% (for passively managed funds).
To which, an insightful committee member asked me, “Well, what should the international allocation be?”
“Lower than 18%,” I said, thinking I was smart. “How about half the current allocation, or about 9%”
The problem with that answer is that it’s subjective. Why 9, why not 8 or 7 or 10 or 12?
“Our investment policy requires we not be involved in market timing.”
Checkmate.
Even though we all agreed reducing international equities made sense, I needed to analyze the problem and present a better solution.
As I ate some humble pie after the committee meeting, I kept wondering how to “prove” a lower allocation made sense. It took me a few days to realize that the proof required one of Charlie Munger’s mental models: Invert, always invert.
How did the endowment decide to invest 18.2% in international stocks in the first place?
“Investment Consultants” with 10-year Forward Expected Returns
The endowment’s financial intermediary was tasked by the committee to decide an asset allocation. The intermediary worked with a third-party investment consultant (who shall remain unnamed). So called consultants, annually publish their 10-year Forward Expected Returns for every asset class.
Equipped with Expected Returns and past volatility for each asset, and correlation across assets, financial intermediaries run Monte Carlo simulations (a fancy way of saying they run thousands of sample portfolios on the computer) to determine an “Efficient Frontier” for allocating capital across portfolios.
The Expected Forward 10-year Returns, that is, from 2023 to 2032 as suggested by that investment consultant were:
| US Stocks | International Stock | Emerging Stocks | |
| 10-year Forward Expected Returns | 6.70% | 8.88% | 10.80% |
That seemed crazy to me! In the 28 years (since 1996) that these asset classes have been tracked by Vanguard Funds, the actual returns earned by international and emerging were HALF. How did the consultants come up with these projections?
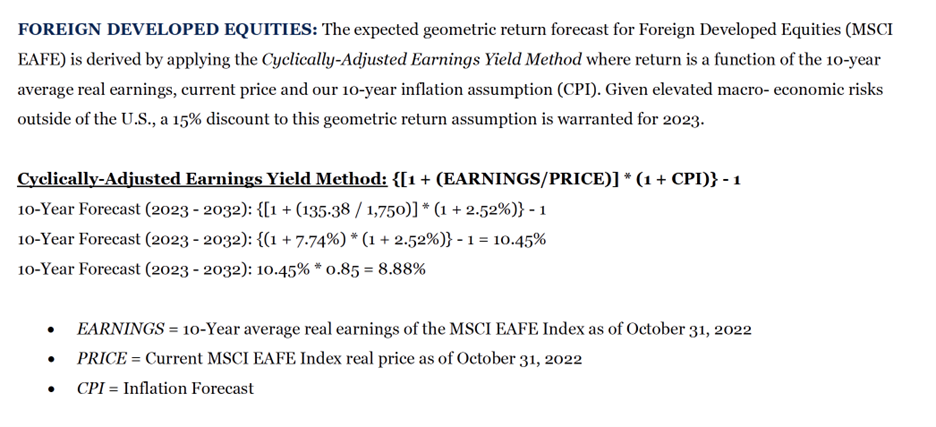
Enter the world of Cyclically Adjusted Earnings Yield. Here’s our consultant’s explanation of the game:
(I am going to leave the source out on purpose)
The formula is basically combining:
- MSCI EAFE earnings (last 10 years of earnings adjusted for past inflation) = 135.38
- prices (current as of end-2022): 1750
- inflation (expected forward inflation): 2.5%
- Foreign discount of 15%
Put it all together and magic. The consultant predicts 8.88% annualized return for MSCI EAFE for the next 10 years. Put that return number along with the Expected Return numbers for the other chosen assets in a sophisticated financial model and you get a portfolio allocation!
I have a healthy respect for simple models. Much better to use a simple model I can follow than a complicated one I cannot follow. But simple better be right. In this case, it’s not.
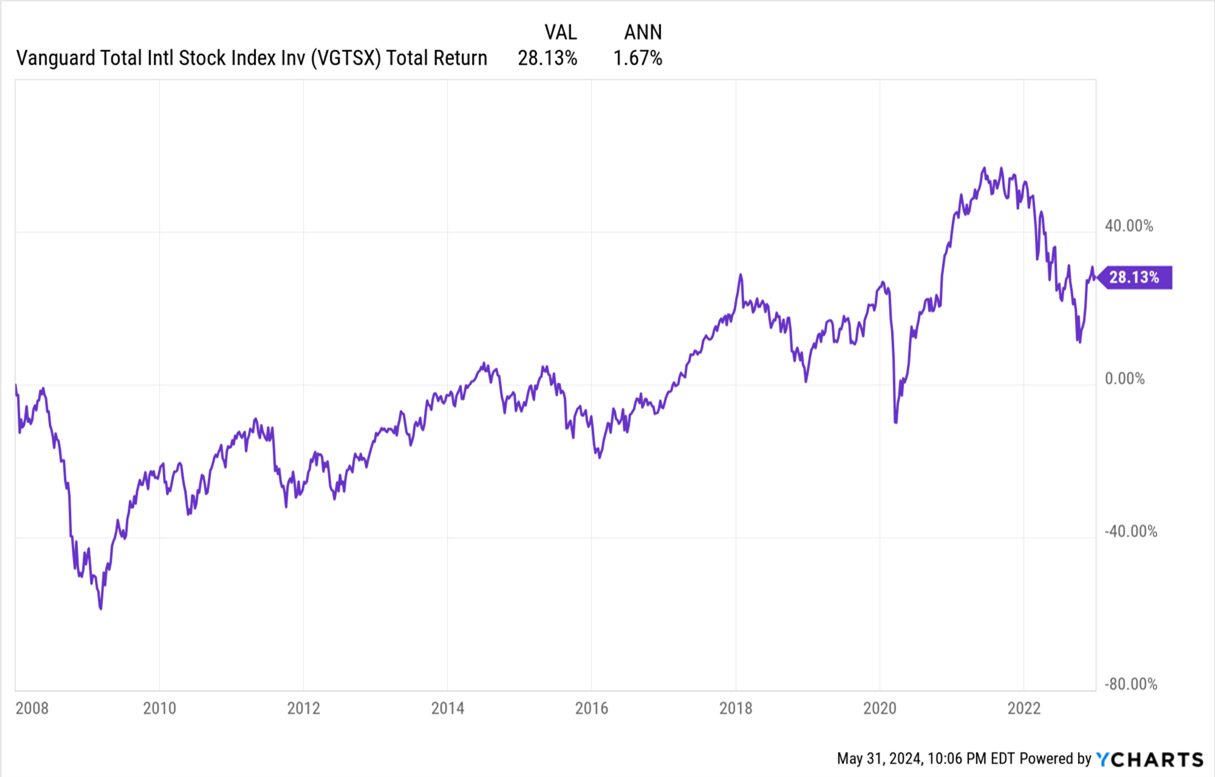
The investment consultant has been calling for returns for MSCI EAFE between 8 and 10% since 2008.
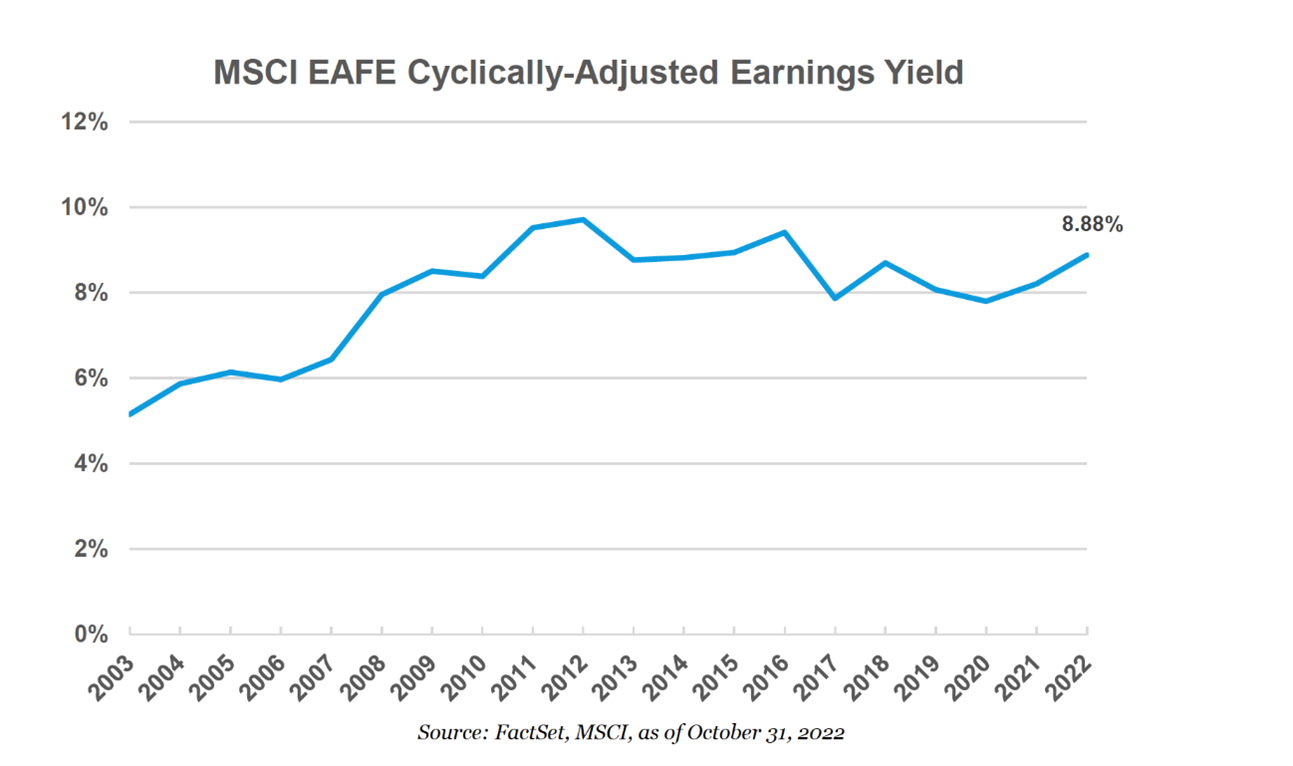
The actual return has been 1.7%!!! There is no connection between the predictions of the investment consultant and reality. Inverting the problem reveals the (passive) Emperor has no clothes. Some actively managed funds focused on international stocks are doing much, much better. But when investment committees decide to pursue passive investing across the board, it’s because they don’t want to choose managers or stocks. This is a problem.
According to MFO Premium $1.1 Trillion dollars are invested in passively managed index funds dedicated to international equities. These are some of the biggest:
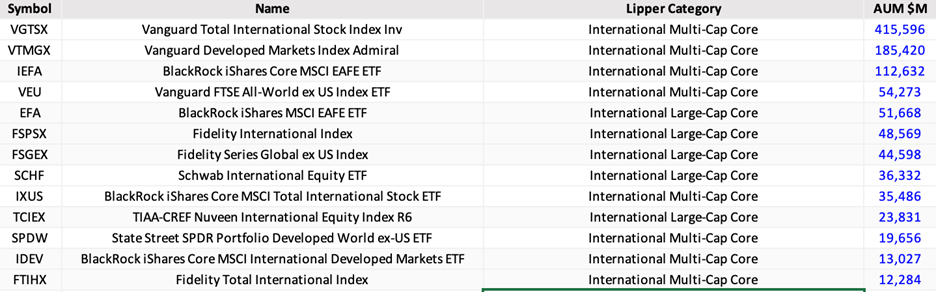
I wonder how many institutions around the country are using Forward Expected Returns of Investment Consultant to invest in these funds.
We got this far, and we know the 18.2% is wrong, but we still don’t know what’s RIGHT.
Alternate Expectations
The big question is what “Expected Return” should be fed into a Monte Carlo model to generate our recommended asset allocation. We would use Portfolio Visualizer to crank out an Optimized Portfolio.
Let us assume the portfolio is to be made up of these three equity asset classes and the Total Bond Portfolio, just four possible asset choices, and their future volatility and cross-asset correlations will be the same as the past. We chose certain ranges for each asset class’s weights in the portfolio. Most will agree the ranges look fair for a US-based investor.
| Total US Equity Portfolio | 40-65% |
| International Developed Equities | 5-20% |
| Emerging Market Equities | 1-10% |
| Total Bond Portfolio | 22-40% |
The financial fiduciary and I came up with three scenarios:
- “Model 2000-2023”: Use each Equity Asset’s actual historical Returns from 2000-2022 as projection for Future Returns
- “Model 2013-2023”: Use each Equity asset’s historical returns from last 10 years, that is from 2013-2022.
- “Model Forward Looking 10-Yr”: Use the Investment Consultant’s projected model (the one we know is wrong)
THE RESULTS:
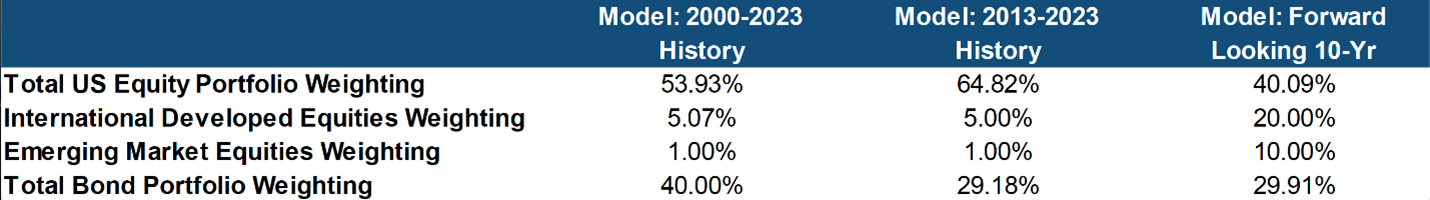
The International Equities weight using Model 1 and 2 (Historical windows) dropped to about 5%, the lower end of our chosen range. Emerging Market Equities dropped to 1%
Round Two with the Investment Committee
We presented our findings to members of the Endowment’s Committee. When we showed the formulas, and how these formulas feed into our portfolio weights, there was a collective sigh. It took only a few minutes for all of the members present to realize that Model 3 (the one we were using made no sense). The Cyclically Adjusted Earnings model was simple, but it was simply wrong.
I don’t think we argued WHY it was wrong. That’s ok. We don’t have to answer all the questions to make the right decision. We just have to have enough information in our corner to change stance. Which we did.
In the Spring of 2023, the school’s endowment committee reduced its weights of passively managed international equities to 5%. The school’s endowment committee also agreed to quickly swapping out the passive funds with active funds (hello, MFO). There are many active funds which do produce returns of 8-9% in international stocks. We would then consider re-upping the portfolio weights to an appropriate weight. It’s commendable that presented with the data, the committee changed its mind and adopted a better investment position. Intellectual flexibility is the key for investment success.
A couple of committee members asked the relevant question: Why not zero weight for international stocks? They are absolutely right in asking the question.
I had two reasons to avoid zero. First, 5% was much lower than the 18% we held earlier. We were moving in the right direction by a substantial margin. My second reason was superstition. Let’s pay the Diversification Gods 5% so our US Equity portfolio continues to chug along beautifully. I got a chuckle from the crowd.
“Devesh, you imposter.”
“Arrest me. I’ve committed a diworsification crime.”
Takeaways for the investment community
I don’t know more than anyone else what the future returns for International equity indices should be. But we know what history says. And history was clear in the returns generated by passive indices internationally. It’s low. And therefore, if you are the passive type of investor, this asset looks like one to keep at a low weight (5% or lower).
Changing Expected Returns can have a massive effect on the asset allocation. It’s worthwhile finding good active managers. As top-class Artisan International Value fund’s David Samra recently said at the fund manager’s investment conference, “Thank you for comparing my fund to a two-foot hurdle!”
ARTKX (unfortunately, a closed fund) has generated 11.7% annualized since inception. It’s probably the only international fund that’s beat the S&P 500 since its inception. Since it’s closed, we need to find other funds that are capable of generating those returns. It’s not an easy act to follow. If I could invest in international funds generating 8-12% returns, I would happily move to 20% weight for the portfolio.
Be careful accepting Efficient Frontier portfolios. Invert. Check assumptions. If you don’t know or can’t see the assumptions, maybe find something simpler to do that works.
An MFO Sidebar Story: The Twenty-Year Record: Artisan International Value and the guys eating its dust
Following Devesh’s lead, we used the MFO Premium screener to identify all of the large-cap international stocks at the top of the 20-year leaderboard. Artisan sits with a 150 bps/year advantage over the second-best performer, and it’s the only value-sensitive fund in the top tier.
| Lipper Category | APR | Sharpe Ratio | Max drawdown | Standard deviat’n | Age | Expense ratio | |
| Vanguard 500 Index | S&P 500 Index | 9.9% | 0.56 | -51% | 14.9 | 48 | 0.14 |
| Artisan International Value | Intl Large Value | 9.3 | 0.49 | -47 | 15.7 | 22 | 1.26 |
| Vanguard International Growth | Intl Large Growth | 7.8 | 0.33 | -57 | 19.3 | 43 | 0.42 |
| Saturna Sextant International | Intl Large Growth | 7.6 | 0.43 | -36 | 14.3 | 29 | 1.00 |
| MFS International Equity | Intl Large Core | 7.5 | 0.37 | -50 | 16.3 | 29 | 0.68 |
| MFS International Growth A | Intl Large-Cap Growth | 7.2 | 0.35 | -52 | 16.2 | 29 | 1.08 |
The only international funds to actually outperform the S&P 500 over the past 20 years? Driehaus International Small Cap Growth, Invesco International Small-Mid Company, Invesco EQV European Small Company, Fidelity Emerging Asia and … Fidelity Nordic?
