 I went on a Bucket List Adventure to Yellowstone National Park last month and stayed at the historic Old Faithful Inn built in 1904. We saw the geysers, the Grand Canyon of Yellowstone with its beautiful falls, majestic bison with their calves, powerful grizzly bears with their cubs, and a coyote crossing through a congested intersection without concern for the traffic.
The other adventure that I went on last month was to take a deeper dive into “Fund Family” performance for exchange-traded funds that invest in domestic equities, global and international equities, and emerging market equities. The concept is to invest with an asset manager that you trust in the areas where they excel with a proven track record. In this article, I focus on large- and multi-cap U.S. Equity and International equity funds that one might include as core funds in a portfolio.
This article is divided into the following sections:
Introduction to Exchange Traded Funds
According to Susan Dziubinski in “What Is an ETF? Morningstar’s ETF Guide“ at Morningstar, “The first exchange-traded fund, SPDR S&P 500 SPY, made its debut in 1993. By the end of 2021, more than $7 trillion in assets rested in ETFs… ETFs, or exchange-traded funds, are funds that trade on exchanges. Like traditional mutual funds, ETFs invest in a basket of stocks, bonds, or some combination of the two. But unlike traditional mutual funds, shares of ETFs trade on a stock exchange, such as the New York Stock Exchange.”
Ms. Dziubinski describes the advantages of ETFs over mutual funds:
- ETFs are easy to buy and sell—and given the fee wars in the industry, ETFs have become virtually free to buy and sell.
- ETFs have a reputation for being tax-efficient (somewhat true).
- ETFs are also known for being low cost (not always true).
- Because many of the most popular ETFs track widely followed and transparent indexes, there’s no mystery behind their performance: It’s usually the performance of the index minus fees.
- Passive ETFs have no key-person risk: If the manager leaves, another can step in without much ado.
She adds that “ETFs distribute fewer and smaller capital gains distributions because so many pursue lower-turnover, passive strategies”, and that “the ETF structure is more tax-efficient.”
The vast majority of my assets are invested in mutual funds, but I keep an eye out for opportunities among exchange-traded funds. Combining lower expense ratios and tax benefits is an incentive for Fund Families to stay competitive for investors by switching from mutual funds to ETFs. In this article, I look at fund performance which is after Fund Family expenses.
I gleaned from the Mutual Fund Observer MultiSearch Tool that there are approximately 2,687 exchange-traded funds with at least one year since the inception date. These are managed by approximately 227 Fund Families. Seventy-five percent of the ETFs are managed by just twenty-nine Fund Families, the largest of which are BlackRock, Invesco, First Trust, State Street, Innovator, Global X, Vanguard, WisdomTree, and Fidelity in descending order. The largest Fund Managers including mutual funds have eighty percent of the Assets Under Management (AUM): Vanguard, Fidelity, BlackRock, American Funds, State Street, JPMorgan, Schwab, Invesco, T Rowe Price.
As an example, by my estimates, Vanguard offers 124 mutual funds and 84 exchange-traded funds. Total Vanguard assets under management (AUM) are approximately $8.9 trillion dollars. There are twenty-one Vanguard funds which have both a mutual fund and exchange-traded fund (share classes) with a total AUM of $4.6 trillion dollars. The average expense ratio for the ETF share class of these pairs is 0.055% while the average expense ratio of the mutual fund share class is 0.18%.
Best Families for U.S. Equity ETFs
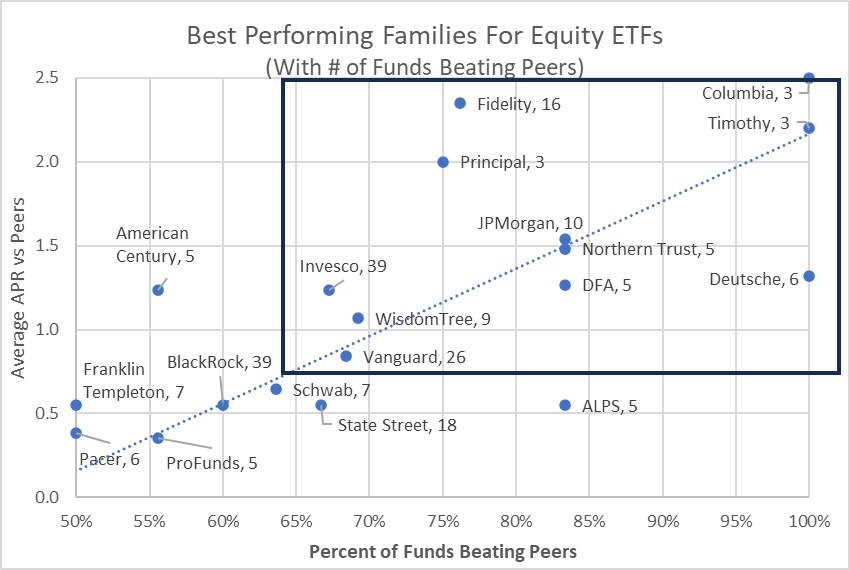
I extracted all (514) U.S. Equity ETFs excluding those using option strategies. I calculated the percentage of funds beating their peers and the average APR for each of the Fund Families over the past three-year period. Figure #1 contains all of the Families with at least half of the funds beating their peers and with at least three ETFs beating their peers, along with an average APR vs Peers greater than zero. I consider the 19 Fund Families (20%) to be the more established, best-performing Fund Families for U.S. Equity ETFs. Those in the dark rectangle are the Fund Families that I will dig a little deeper on their performance. I consider the number of funds beating peers to be a loose measure of level of confidence. The stand out manager for U.S. Equity ETF performance is Fidelity.
Figure #1: Best Performing Fund Families for U.S. Equity ETFs
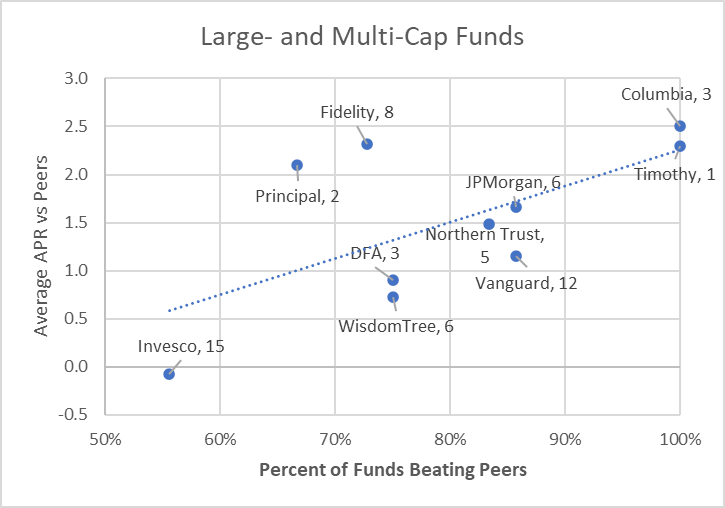
Table #1 contains US Equity ETFs in Lipper Categories with a large number of funds for comparison purposes with metrics covering the past three years. While all of the Fund Families have performed above average for the Lipper Categories, those at the top have higher average “Percent Beating Peers”, average annualized returns, and risk-adjusted returns (Martin Ratio). When narrowed to large- and Multi-Cap U.S. Equity ETFs, Fidelity and Vanguard are the dominant Fund Families while Columbia, Principal, Wisdom Tree, JP Morgan, and Northern Trust also stand out.
Table #1: Best Performing Fund Families for U.S. Equity Large- and Multi-Cap ETFs
Figure #2 represents those ETFs in Large- and Multi-Cap Lipper Categories from the table above in graphical form.
Figure #2: Best Performing Fund Families for U.S. Equity Large- & Multi-Cap ETFs
Table #2 lists some of the outperforming funds while Figure #3 is a graphical representation.
Table #2: Selected Top Performing Large- and Multi-Cap U.S. Equity ETFs
Figure #3: Selected Top Performing Large- and Multi-Cap U.S. Equity ETFs
Best Families for International Equity ETFs
I extracted 144 Global and International Equity Funds and narrowed the list down to eleven Fund Families with International Large- and Multi-Cap that outperform their peers as shown in Table #3 and Figure #4. Of the International Equity Large- and Multi-Cap ETFs, Deutsche, New York Life, DFA, Fidelity, and Schwab have the highest performance.
Table #3: Best Performing Fund Families for International Large- and Multi-Cap ETFs
Figure #4: Best Performing Fund Families for International Large- and Multi-Cap ETFs
Table #4 contains example ETFs that outperform from these Fund Families with high performance in the Large- and Multi-Cap International ETF arena. Figure #5 represents the same funds in graphically.
Table #4: Selected Top Performing Large- and Multi-Cap International Equity ETFs
Figure #5: Selected Top Performing Large- and Multi-Cap International Equity ETFs
Best Families for Emerging Market Equity ETFs
Emerging Markets have the potential to provide higher growth, but with additional volatility. I like to invest a small percentage in diversified emerging markets excluding country-specific funds and those with below average allocations to China. I extracted a total of 40 ETFs that are invested in diversified Emerging Markets. The thirty-four best performers are spread among sixteen Fund Families. Examples of ETFs from the Fund Families are shown in Table #5 and Figure #6.
Table #5: Selected Top Performing Emerging Market Equity ETFs
Figure #6: Selected Top Performing Emerging Market Equity ETFs
Building a Diversified Equity Portion of a Portfolio
Table #6 shows some of the best-performing ETFs from the Fund Families and Lipper Categories discussed in this article. In general, U.S. Equity funds have performed better than International Equities, so why invest internationally? Valuations for U.S. Equity funds are much higher than International and Emerging Market Equity funds. Approximately twenty-five percent of my equity allocation is outside of North America for this reason as well as diversification.
Table #6: Author’s Picks for the Equity Portion of a Portfolio – Three-Year Metrics
I created a portfolio of the above ETFs representing a hypothetical equity portion of a portfolio for the past 6.4 years using the Mutual Fund Observer Portfolio Tool. The funds are rated highly for both APR and MFO for risk-adjusted return. Four of the funds are MFO Great Owls. The portfolio would have returned nearly 10% over the past six years.
Table #7: Author’s Example Equity Portion of a Portfolio – 6.4 Year Metrics
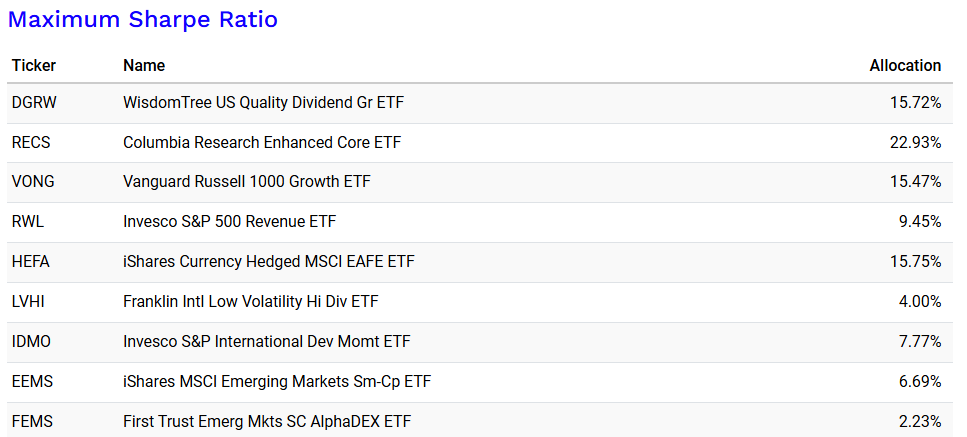
Next, I used Portfolio Visualizer Portfolio Optimization to select the funds to create an example of the equity portion of a portfolio that maximize the Sharpe Ratio (volatility-adjusted returns). The link to Portfolio Visualizer is here.
Table #8: Example Equity Portion of a Portfolio Using Portfolio Visualizer
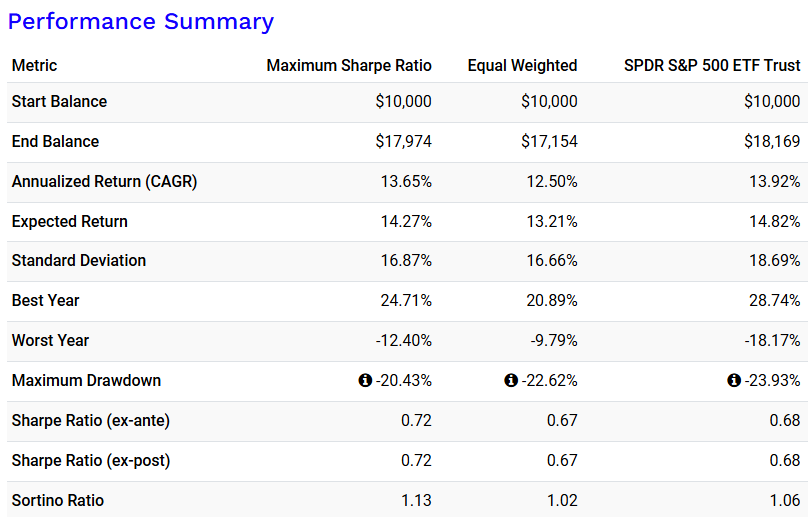
Figure #7 compares the results of the above portfolio to a portfolio with equal weights for the nine ETFs.
Figure #7: Example Equity Portion of a Portfolio Using Portfolio Visualizer
Table #9: Example Equity Portion of a Portfolio Using Portfolio Visualizer
I next compared the portfolio of funds that I selected to that I created with the assistance of Portfolio Visualizer. The link to Portfolio Visualizer’s Portfolio Backtest is here. Figure #8 is constrained by the life of Dimensional International Value ETF (DFIV). These two portfolios performed well and in a similar fashion.
Figure #8: Author’s Equity Portfolio Compared to the Portfolio Visualizer Assisted Portfolio
Review Of Author’s ETFs
The future is guaranteed to be different than the past, at least to some degree. I recommend that people consider using a Financial Advisor. I use both Fidelity and Vanguard advisory services to manage the longer-term accounts which contain more of the equity funds. Writing this article helps evaluate their strategies and to build the positions that I manage. In particular, using the Bucket Approach to include the impact of taxes lumps longer-term buy and hold equity funds together.
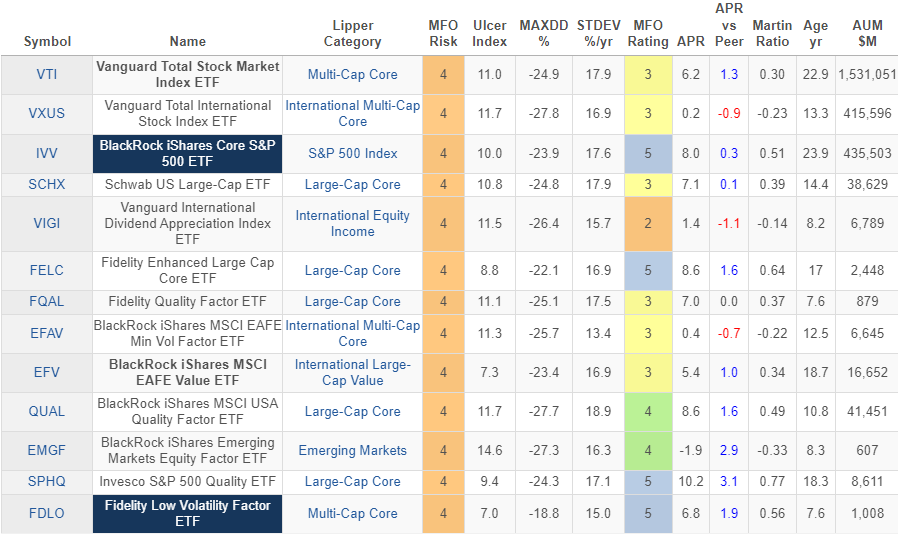
The ETFs below are the ones that either the Advisors or myself have selected for the Lipper Categories covered in this article. In addition, some serve the purpose of long-term buy and hold funds while others are intended for tax loss harvesting. I like to regularly review the funds that I own for purpose and performance. The Vanguard International Dividend Appreciation Index ETF (VIGI) is on my watch list to possibly replace if opportunities exist without creating higher taxes.
Table #10: Metrics of ETFs Owned by the Author – Three Years
Closing
I own AVGE which I wrote about in “One of a Kind: American Century Avantis All Equity Markets ETF (AVGE)”, but did not discuss it in this article because of its short life and the relatively low number of ETFs in this Global Multi-Cap Core Lipper Category. Of the Global Multi-Cap Core ETFs, AVGE sits in the middle of the pack during its short 1.5-year life, outperforming its peers by 0.4 points. State Street SPDR MSCI World StrategicFactors ETF (QWLD), State Street SPDR Portfolio MSCI Global Stock Market ETF (SPGM), and Vanguard Total World Stock Index ETF (VT) have outperformed AVGE. I will continue to monitor AVGE, but have no intention of trading it based on a short evaluation period.
I retired two years ago and have been simplifying. I now spend more time volunteering for Habitat For Humanity than I spend on investments. I enjoy staying on top of industry trends and writing financial articles. I am leaving on my next adventure tomorrow to the Royal Gorge in Colorado and the historic mining district of Cripple Creek.


