Up to this point in 2024, the median builder has sold 22% of its homes to buyers who used all cash to pay for them (i.e., did not take out a mortgage), according to a recent NAHB survey. The survey took the form of a special question appended to the instrument used to collect data for the May NAHB/Wells Fargo Housing Market Index.
The percentage of all-cash sales is interesting, in part because it may indicate the availability of mortgage credit. Recently, the percentage has fluctuated directly with interest rates—especially the Federal Reserve’s target federal funds rate. This was discussed in detail in an earlier post on the Census Bureau’s quarterly “New Houses Sold by Price and Financing” release. Briefly, the Census release shows the share of all-cash sales increasing substantially since the Fed began tightening in 2022, reaching a peak of 10.7% in the fourth quarter of 2023 before declining to 6.6% in early 2024.
This is obviously a much lower share of all-cash sales than the 22% median reported in the May 2024 NAHB survey. Before simply concluding that the two surveys contradict each other, we should consider possible explanations.
The quarterly Census report is based on a sample of new homes. The NAHB survey is based on a sample of builders, many of whom tend to be small (see, for example, the recent article on Who Are NAHB’s Builder Members?). Larger builders, by definition, build a disproportionate number of the new homes; so, if larger builders tend to have smaller shares of all-cash sales, the different sampling frames could explain the apparent discrepancy between the Census and NAHB percentages.
This is not the case, however. In fact, in the NAHB survey, it is the smallest builders who show the lowest share of all-cash sales.

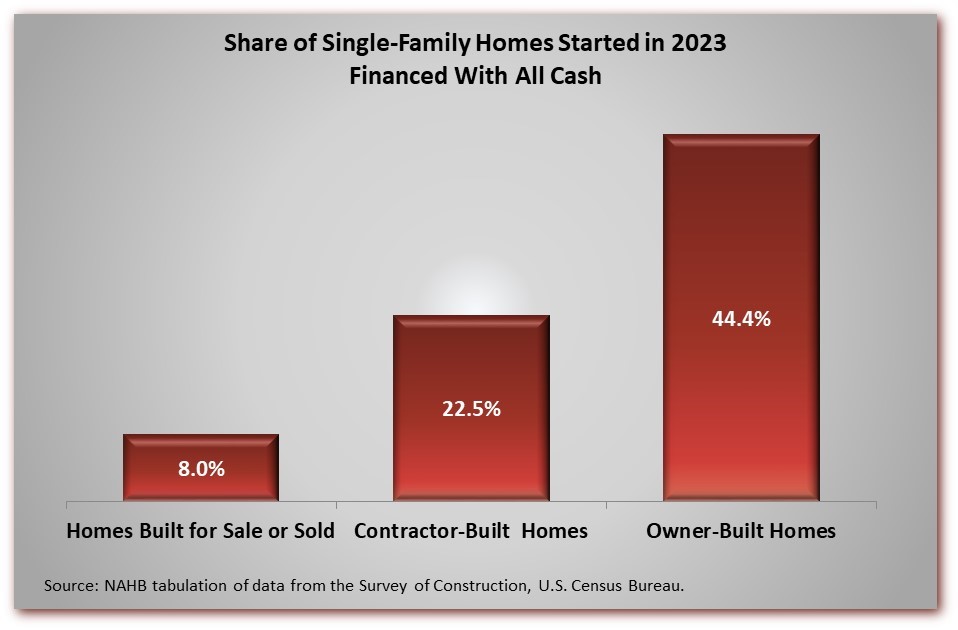
There is another possibility, if we get into the Census Bureau’s definitional weeds. The quarterly Census report is based on new homes sold, meaning that a potential buyer has either signed a sales contract or made a downpayment on the home. But this does not cover all new single-family homes. The Census Bureau classifies others as contractor-built or owner-built. On a contractor-built home, the ultimate homeowner hires a general contractor (i.e., builder) to build an individual home on the owner’s lot. This usually involves a contract to build, but that is not technically the same thing as a sales contract according to Census definitions. On an owner-built home, the owner functions as the general contractor.
In addition to the quarterly report on houses sold, the Census Bureau produces an annual file from the same underlying data that can be tabulated for all types of new single-family homes. NAHB recently tabulated the 2023 file, and it shows that contractor-built (and owner-built) homes are much more likely than homes built for sale to be financed with all cash.

In NAHB’s latest census of its members, 54% of single-family builders listed their primary operation as single-family custom building, which roughly corresponds to building contractor-built homes under the Census Bureau’s classification scheme.
To summarize, NAHB’s May 2024 survey shows a median of 22% all-cash sales, considerably higher than the recent peak of 10.7% reported by the Census Bureau in its quarterly release on new houses sold. The discrepancy does not seem attributable to the differences between a survey of houses and a survey of builders but may be largely due to the presence of custom builders in the NAHB survey. These are builders who specialize in contractor-built homes, which are demonstrably more likely to be financed entirely with cash but are excluded from the reports on new houses sold.
The NAHB survey results are therefore useful for timely information on new home financing that includes custom home building.
Discover more from Eye On Housing
Subscribe to get the latest posts to your email.

