
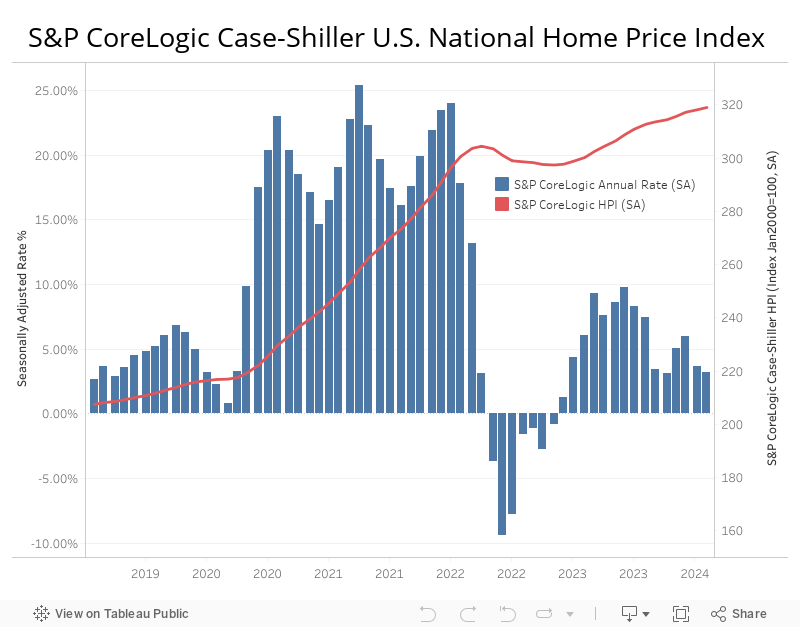
The S&P CoreLogic Case-Shiller U.S. National Home Price Index (HPI) increased at a seasonally adjusted annual rate of 3.18% for April. This was following a revised rate of 3.69% in March.
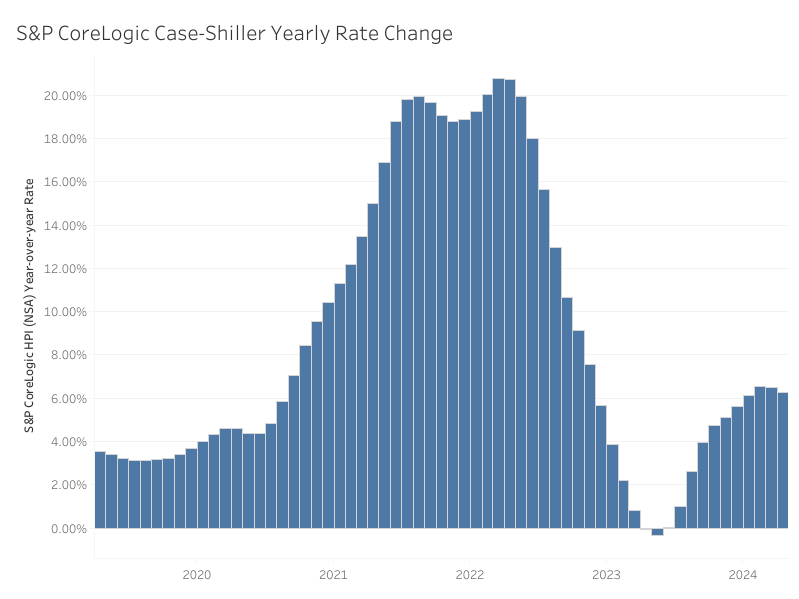
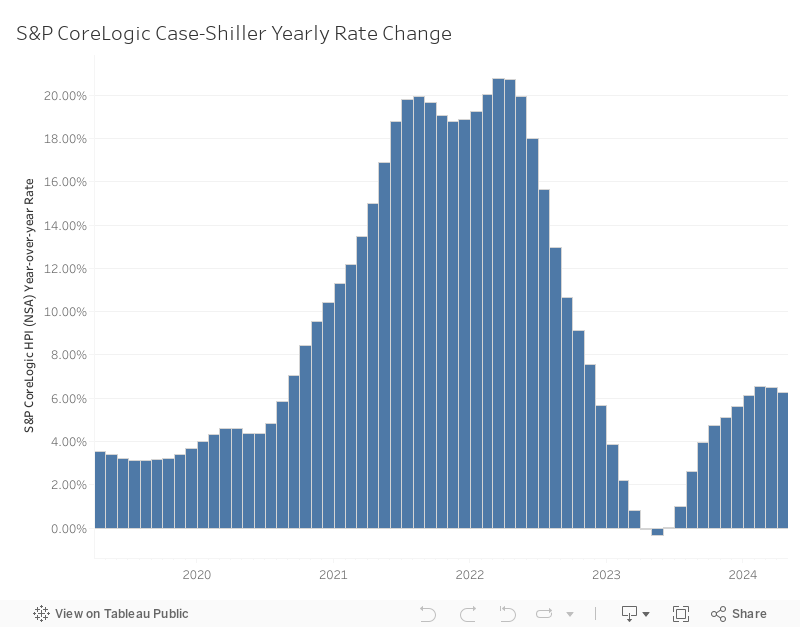
On a year-over-year basis, the non-seasonally adjusted (NSA) index posted a 6.29% annual gain in April, following a 6.52% increase in March. As shown in the graph below, the index year-over-year rate peaked at 20.79% post-COVID in March of 2022. This was followed by continual declines that bottomed out at -0.35% in May of 2023. Since May, the index has seen steady increases but has marginally slowed over the past two months.
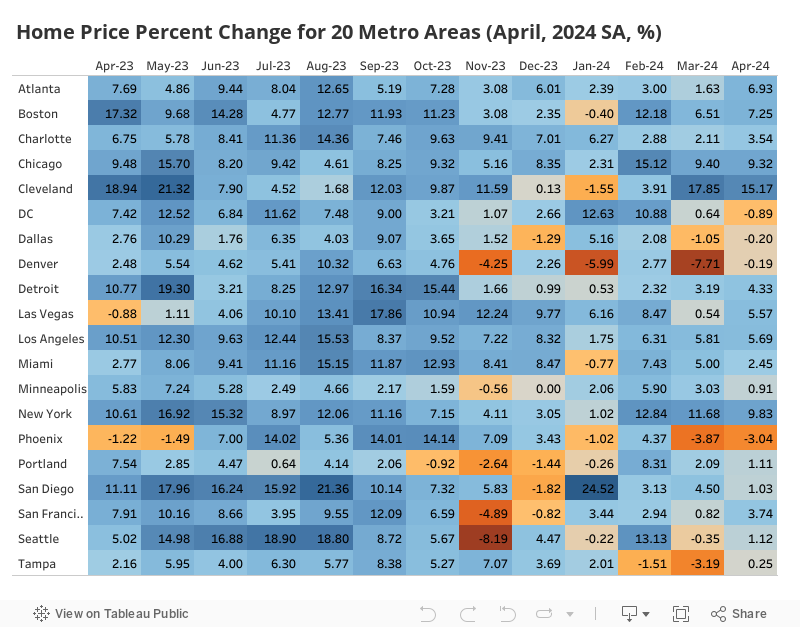
In addition to tracking national home price changes, S&P Dow Jones Indices also reported home price indexes across 20 metro areas in April on a seasonally adjusted basis. Four out of 20 metro areas reported home price depreciation: Phoenix at -3.04%, D.C. at -0.89%, Dallas at -0.20%, and Denver at -0.19%. Among the 20 metro areas, ten exceeded the national rate of 3.18%. Cleveland had the highest rate at 15.17%, followed by New York at 9.83%, and then Chicago with a 9.32% increase.
Meanwhile, the Home Price Index released by the Federal Housing Finance Agency (FHFA), rose at a seasonally adjusted annual rate of 2.84% for April, increasing from a revised 0.54% rate in March. On a year-over-year basis, the FHFA Home Price NSA Index rose 6.39% in April, down from 6.77% in March.
Discover more from Eye On Housing
Subscribe to get the latest posts to your email.
