

Total (new and existing) home inventory is an important measure for gauging and forecasting home prices and home construction impacts. The intuition is clear: more inventory yields weaker or declining home price growth and home building activity. Lean inventory levels lead to price growth and gains for home building.
The metric “months’ supply” is a common measure of current market inventory. For both new and existing home markets, months’ supply converts inventory from a count of homes into a measure of how many months it would take for that count of home inventory to be sold at the current monthly sales pace.
Housing economists typically advise that a balanced market is a five- to six-months’ supply. Larger inventory levels than this benchmark risk producing deteriorating conditions for price growth and building activity.
In the Census May 2024 newly-built home sales data, the current months’ supply of inventory is 9.3. Some analysts have noted that, given the five- to six-month benchmark, that this means the building market for single-family homes is possibly oversupplied, implying declines for construction and prices lie ahead.
However, this narrow reading of the industry misses the mark. First, it is worth noting that new home inventory consists of homes completed and ready to occupy, homes currently under construction and homes that have not begun construction. That is, new home inventory is a measure of homes available for sale, rather than homes ready to occupy. In fact, just 21% of new home inventory in May consisted of standing inventory or homes that have completed construction (99,000 homes).
More fundamentally, an otherwise elevated level of new home months’ supply is justified in current conditions because the inventory of resale homes continues to be low. Indeed, according to NAR data, the current months’ supply of single-family homes is just 3.6, well below the five- to six-month threshold. It is this lack of inventory that has produced ongoing price increases despite significantly higher interest rates over the last two years.
Taken together, new and existing single-family home inventory, the current months’ supply of both markets is just 4.4, as estimated for this analysis. This is admittedly higher than the 3.6 reading, using this approach, from a year ago, but it still qualifies as low. See the following graph for total months’ supply going back to the early 1980s using data from the NAR existing home sales series and the Census new home sales data, as calculated by NAHB.
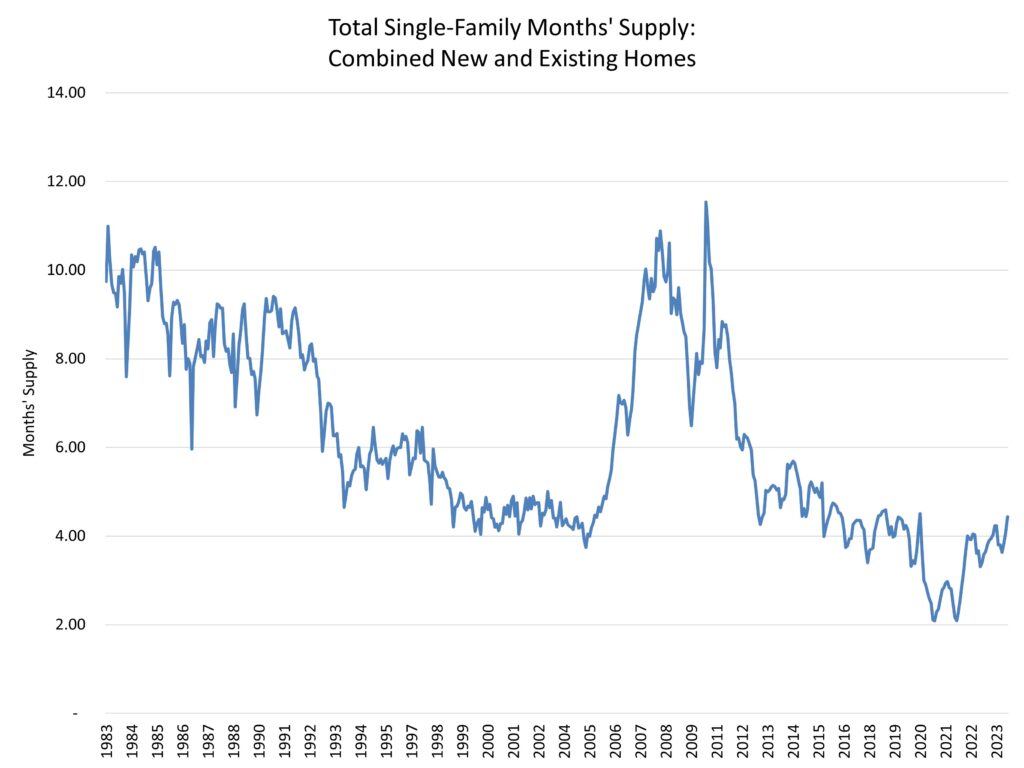
Yes, inventory is rising and will continue to rise, particularly as the mortgage rate lock-in effect diminishes in the quarters ahead. But current inventory levels continue to support, on a national basis, new construction and some price growth, per this current reading of total months’ supply.
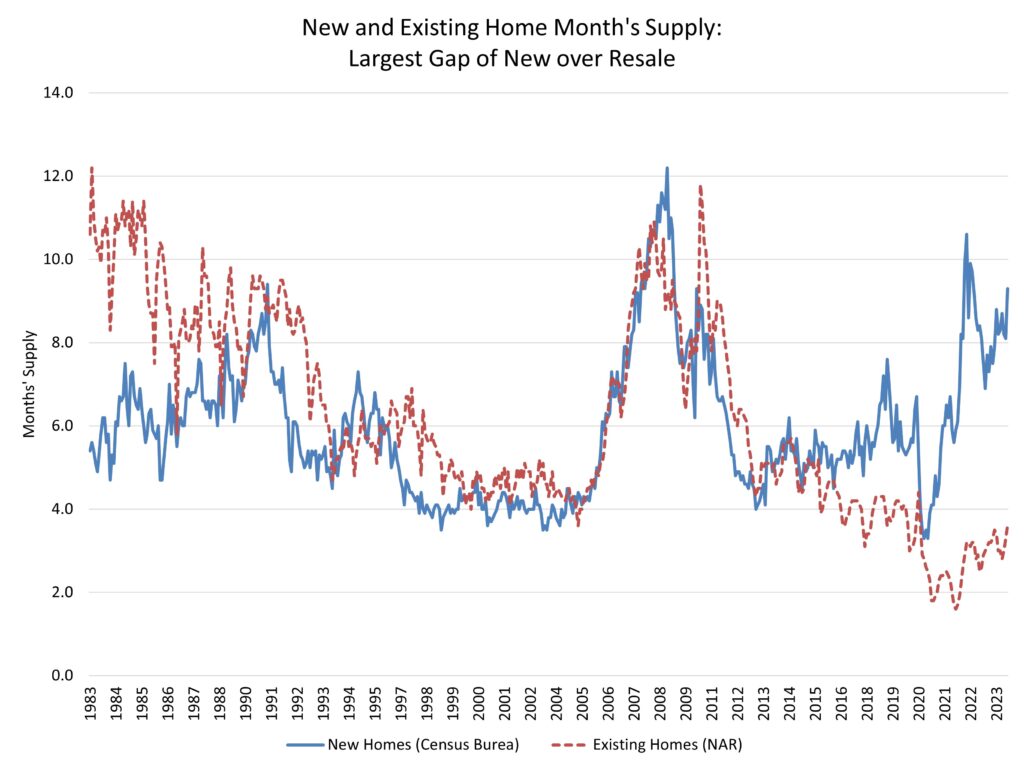
Further, the housing deficit (NAHB estimates about 1.5 million homes), which was produced by a decade of underbuilding due to a perfect storm of supply-side challenges, has generated a separation in the normally co-linear measures of new and existing home months’ supply. This separation became particularly pronounced during the COVID and post-COVID period of the housing market. June 2022 recorded the largest ever lead of new home months’ supply (9.9) over existing single-family home months’ supply (2.9). This separation makes it clear that an evaluation of current market inventory cannot simply examine either the existing or the new home inventory in isolation.
With the current total months’ supply at 4.4, what does this mean for the market, particularly with respect to pricing and construction trends? To examine this question, I calculated the total months’ supply reported on the first graph in this post. I then examined price movements and single-family construction starts data with respect to current total months’ supply. The results are broadly consistent with the existing rules of thumb regarding market conditions.

The horizontal axis plots total months’ supply for monthly data going back to the start of 1988 (the starting point of the price data used for this analysis). The vertical axis records the corresponding year-over-year home price growth for the same month as measured by the Case-Shiller Home Price Index. The trend line is estimated using a simple linear regression. The statistical correlation indicates that home price growth, on average, turns negative when inventory reaches an 8-months’ total supply (on the graph, the trend line intersects the horizontal axis, measuring zero percent price growth, at 8 months’ supply).
To be clear, this does not mean that prices will not fall until months’ supply exceeds eight. For example, 24% of the data registering 6.5 to 7.5 months’ supply recorded home price declines. For the data in the range of 7.5 months’ supply to less than 8 months’ supply, this share increased to 36%. Overall, for months with less than an eight months’ supply, it was less likely than not to see home price declines, but it did happen in certain market conditions.
And to be complete, home prices did not always fall when total inventory was greater than an eight months’ supply. For example, for months with a months’ supply measure of 8.5 to 9.5, homes prices increased 36% of the time.
Taken together, these general trends indicate that a months’ supply of less than eight has historically been positive for nominal home price growth. That’s where markets conditions are today.
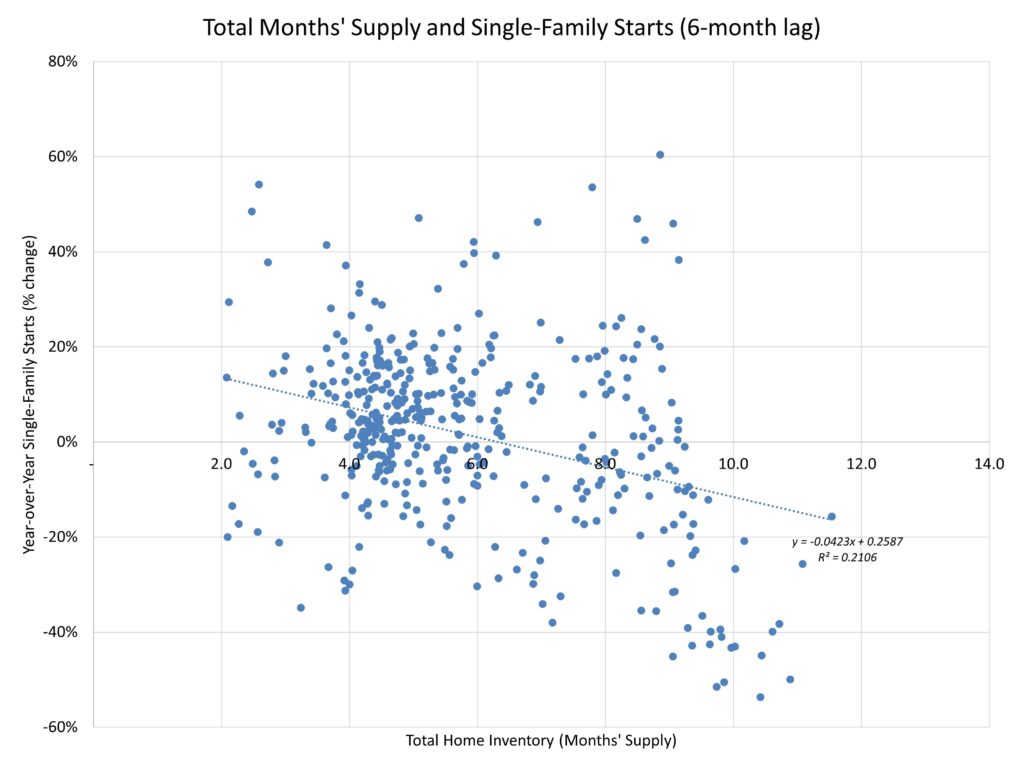
What about impacts for single-family home building? The data are little less clear (as seen by smaller R-squared measures on the trends), but this should not be a surprise. Home building is a function of both demand-side housing factors, like mortgage interest rates, as well as volatile supply-side variables like the cost and availability of labor, lots, lending, lumber/materials, and legal/regulatory policies and fees. Nonetheless, using Census housing starts data and the same total months’ supply metric, a trend is apparent, and it is one that matches up well with existing rules of thumb.
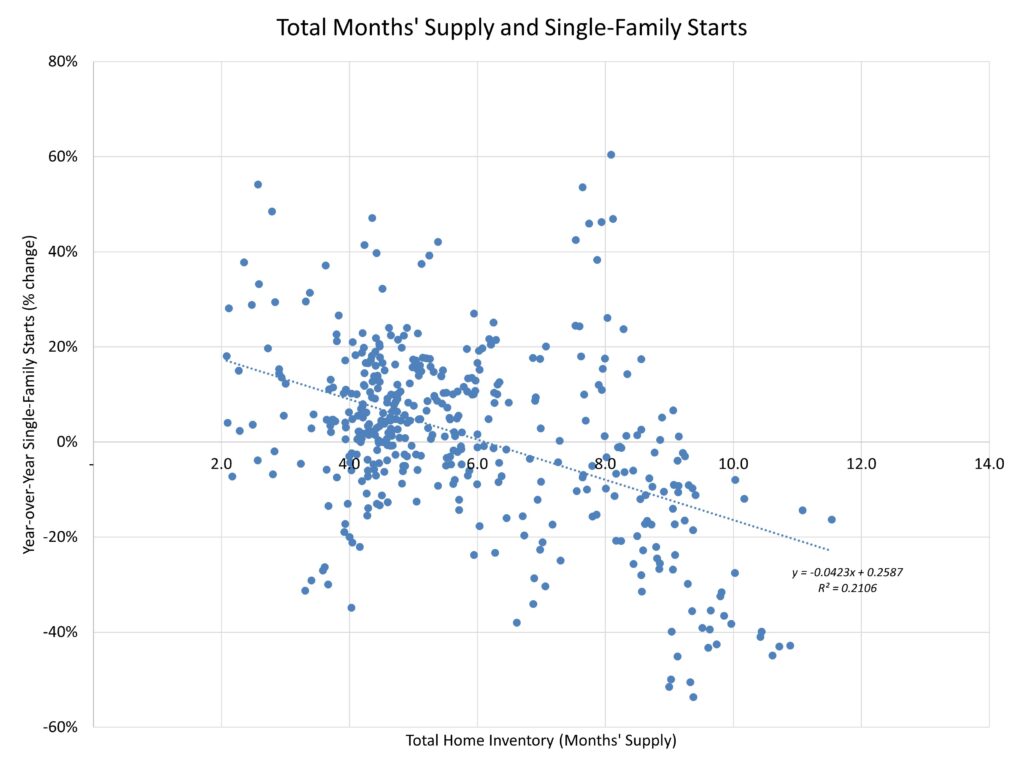
As the chart above indicates, a simple linear trend of monthly data going back to mid-1982 (the limit of the supply data) indicates that at roughly 6-months’ total home inventory, single-family home building reaches a zero percent year-over year growth rate. As before, and as seen in the graph above, the correlation is not absolute.
For example, for otherwise tight 4.5 months’ to 5.5 months’ new and existing home supply, single-family home building did contract 27% of the time. On the other hand, for markets with more inventory than the benchmark (6.5 to 7.5 months’ supply), home building expanded 30% of the measured months. As with home prices, the trend is not absolute, but the six-months’ supply benchmark is a useful rule of thumb for examining whether builders will reach a neutral stance for expanding home construction activity.
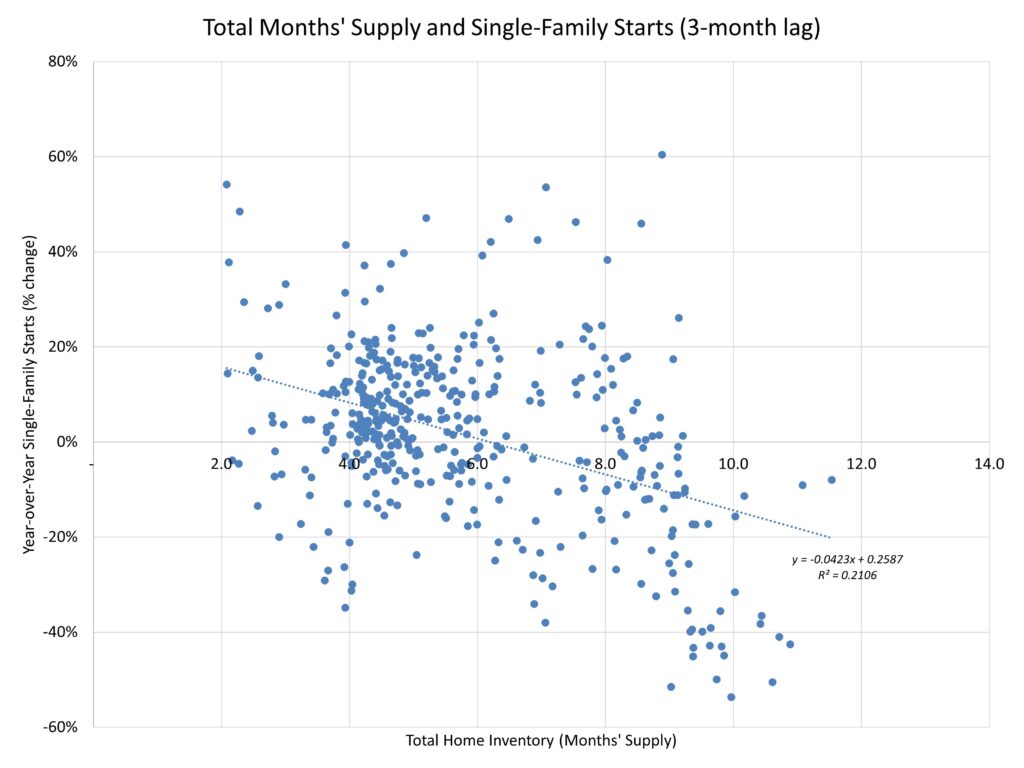
It is worth noting that home builder production can occur with a lag with respect to inventory conditions. For example, the time between permit approval and the start of construction was approximately 1.3 months in 2022 (2023 data will be available in the coming months). And single-family construction time averaged 8.3 months, per NAHB estimates using Census data. Mindful of these lags, I examined the impact of total months’ supply on single-family starts with both a three-month and six-month lag. In both analyses, the 6-months’ benchmark was again validated. For a relatively straightforward analytical approach, this represents a fairly robust result, albeit one with a notable amount of statistical noise due to supply-side factors associated with construction inputs and constraints.
The data thus show that current market conditions are unusual, with a large gap between new and existing single-family months’ supply. Analyses that rely on just one of these measures will be misleading. A total months’ supply measure that measures both new and existing inventory is required to gauge the status of inventory conditions and possible impacts on home prices and home building.
Furthermore, the historical correlations suggest that home builders will significantly slow home building activity at a 6-months’ supply of total housing inventory. And price declines become more likely than not at an 8-months’ supply.
In the meantime, builders, housing stakeholders, and analysts should view the current nine months’ supply for new homes within its proper context. This will be particularly important as resale levels continue to rise, with additional gains expected to occur as the mortgage-rate lock-in effect diminishes in the quarters ahead. However, keep in mind, lower mortgage rates will also unambiguously improve housing affordability conditions and price prospective home buyers back in the market, thus putting downward pressure on the months’ supply metric by increasing sales rates.
With each Census new home sales report, NAHB will continue to estimate and watch the total months’ supply measure. But given this analysis, at 4.4 total months’ supply, inventory levels have increased but remain low and supportive of limited gains for home building and upward pressure on nominal home prices.
Discover more from Eye On Housing
Subscribe to get the latest posts to your email.
