

Inflation dropped below a 3% annualized growth rate for the first time since March 2021 even though housing costs continue to climb. Nonetheless, the headline reading is another dovish signal for future monetary policy, following signs of weakness in the most recent job report.
Despite a slowdown in the year-over-year increase, shelter costs continue to exert significant upward pressure on inflation, contributing nearly 90% of the monthly increase in overall inflation and over 70% of the total 12-month increase in core inflation. As consistent disinflation and a cooling labor market bring the economy into better balance, the Fed is likely to further solidify behind the case for rate cuts, which could help ease some pressure on the housing market.
The Fed’s ability to address rising housing costs is limited because increases are driven by a lack of affordable supply and increasing development costs. Additional housing supply is the primary solution to tame housing inflation. However, the Fed’s tools for promoting housing supply are constrained. In fact, further tightening of monetary policy would hurt housing supply because it would increase the cost of AD&C financing. This can be seen on the graph below, as shelter costs continue to rise despite Fed policy tightening. Nonetheless, the NAHB forecast expects to see shelter costs decline further in the coming months. This is supported by real-time data from private data providers that indicate a cooling in rent growth.

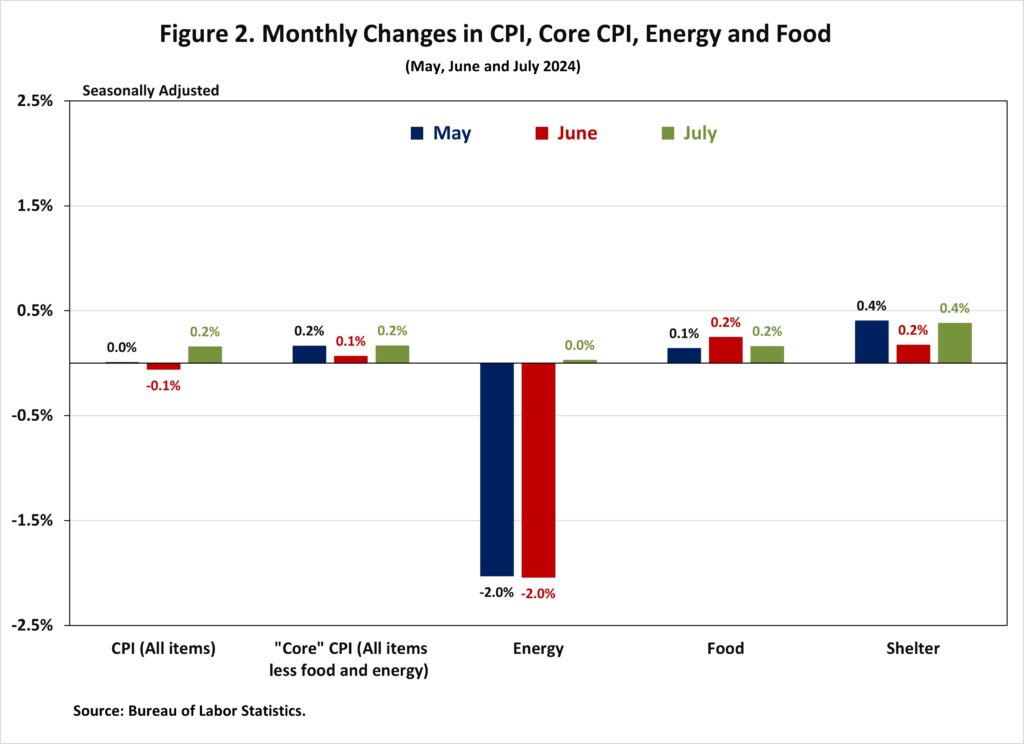
The Bureau of Labor Statistics reported that the Consumer Price Index (CPI) rose by 0.2% in July on a seasonally adjusted basis, after declining 0.1% in June. Excluding the volatile food and energy components, the “core” CPI increased by 0.2% in July, after a 0.1% increase in June.
The price index for a broad set of energy sources remained flat in July, with increases in electricity (+0.1%) and fuel oil (+0.9%) offsetting a decline in natural gas (-0.7%). The natural gas index was unchanged in July. Meanwhile, the food index rose 0.2%, as it did in June. The index for food away from home increased by 0.2% and the index for food at home rose 0.1%.
In July, the index for shelter (+0.4%) continued to be the largest contributor to the monthly increase in all items index. Among other top contributors that rose in July include indexes for motor vehicle insurance (+1.2%) as well as household furnishings and operations (+0.3%). Meanwhile, the top contributors that experienced a decline in July include indexes for used cars and trucks (-2.3%), medical care (-0.2%), airline fares (-1.6%), and apparel (-0.4%). The index for shelter makes up more than 40% of the “core” CPI. The index saw a 0.4% rise in July, following an increase of 0.2% in June. The indexes for owners’ equivalent rent (OER) increased by 0.4% and rent of primary residence (RPR) rose by 0.5% over the month. These gains have been the largest contributors to headline inflation in recent months.
During the past twelve months, on a non-seasonally adjusted basis, the CPI rose by 2.9% in July, following a 3.0% increase in June. The “core” CPI increased by 3.2% over the past twelve months, following a 3.3% increase in June. This was the slowest annual gain since April 2021. Over the past twelve months, the food index rose by 2.2%, and the energy index increased by 1.1%. This marks the fifth consecutive month of year-over-year increases for the energy index since February 2024.
NAHB constructs a “real” rent index to indicate whether inflation in rents is faster or slower than overall inflation. It provides insight into the supply and demand conditions for rental housing. When inflation in rents is rising faster than overall inflation, the real rent index rises and vice versa. The real rent index is calculated by dividing the price index for rent by the core CPI (to exclude the volatile food and energy components). In July, the Real Rent Index rose by 0.3%, after a 0.2% increase in June. Over the first seven months of 2024, the monthly growth rate of the Real Rent Index averaged 0.1%, slower than the average of 0.2% in 2023.

Discover more from Eye On Housing
Subscribe to get the latest posts sent to your email.
