

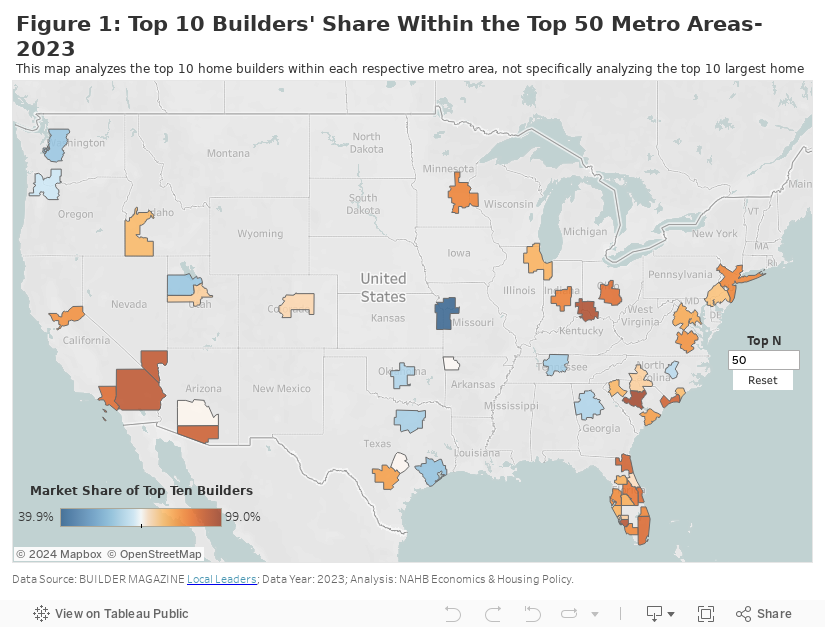
NAHB analyzed the national market share data released by BUILDER Magazine in a previous blog post. Last month, BUILDER Magazine released new data on the top 10 home builders within each of the 50 largest new home markets in the U.S. (ranked by single-family permits) (Figure 1). It is important to note that this post is not specifically analyzing the top 10 largest home builders nationally and each market can differ in its respective top 10 home builder composition.
The top 10 home builders accounted for varying shares, ranging from 40.1% of single-family permits in the Kansas City area to 98.8% in Columbia, SC. In 11 metro areas, the top 10 builders’ market share exceeded 90%. Across the 50 largest metro areas, the average market share of the top 10 builders was 78.2%, up from 73.3% in 2022.
Looking at results on a map reveals that Florida, South Carolina, Virginia, and southern California have multiple highly concentrated markets. Texas and the Northwest include markets with lower levels of concentration.
D.R. Horton made the top 10 builder list in 47 markets, the most among all builders. Lennar and PulteGroup followed, present in the top 10 builder list of 45 and 35 different metro markets, respectively.
From 2022 to 2023, 34 metro areas saw an increase with their top 10 builders’ market share while nine metro areas saw decreases. The top 5 metro areas with the biggest increases were:
- Los Angeles-Long Beach-Anaheim, CA (90.3%, +26 percentage points)
- Myrtle Beach-Conway-North Myrtle Beach, SC-NC (92.3%, +16.4 percentage points)
- Riverside-San Bernadino-Ontario, CA (94.9%, +16.1 percentage points)
- Cape Coral-Fort Myers, FL (96.2%, +15.3 percentage points)
- New York-Newark-New Jersey City, NY-NJ-PA (62.6%, +14.9 percentage points)
Of the nine metro markets that saw decreases in the single-family permit share controlled by their top 10 builders, the five largest decreases were seen in:
- Portland-Vancouver-Hillsboro, OR-WA (66%, -8.7 percentage points)
- North Port-Sarasota-Bradenton, FL (79.1%, -7.4 percentage points)
- Deltona-Daytona Beach-Ormond Beach, FL (72.4%, -7.2 percentage points)
- Seattle-Tacoma-Bellevue, WA (59.4%, -5.5 percentage points)
- Salt Lake City, UT (59.3%, -4.3 percentage points)
Discover more from Eye On Housing
Subscribe to get the latest posts sent to your email.
