Our friends and long-time MFO Premium subscribers at S & F Investment Advisors of Encino, CA asked recently if we could replicate metrics based on Lipper’s Global Data Feed that Barron’s stopped publishing; specifically: Lipper Mutual Fund Investment Performance Averages – Specialized Quarterly Summary Report.
We then coordinated with the folks at Lipper to ensure we used all the same funds, share classes, and categories to match their averages, which we did.
S & F uses these averages, specifically the General Equity Average, for its quarterly reports and benchmarks. General Equity includes 16 of the more common US Equity categories, including Small-, Mid-, Large- and Multi-Cap Value, Core, and Growth funds. (The specific definition can be found on our Definitions page, under Averages.
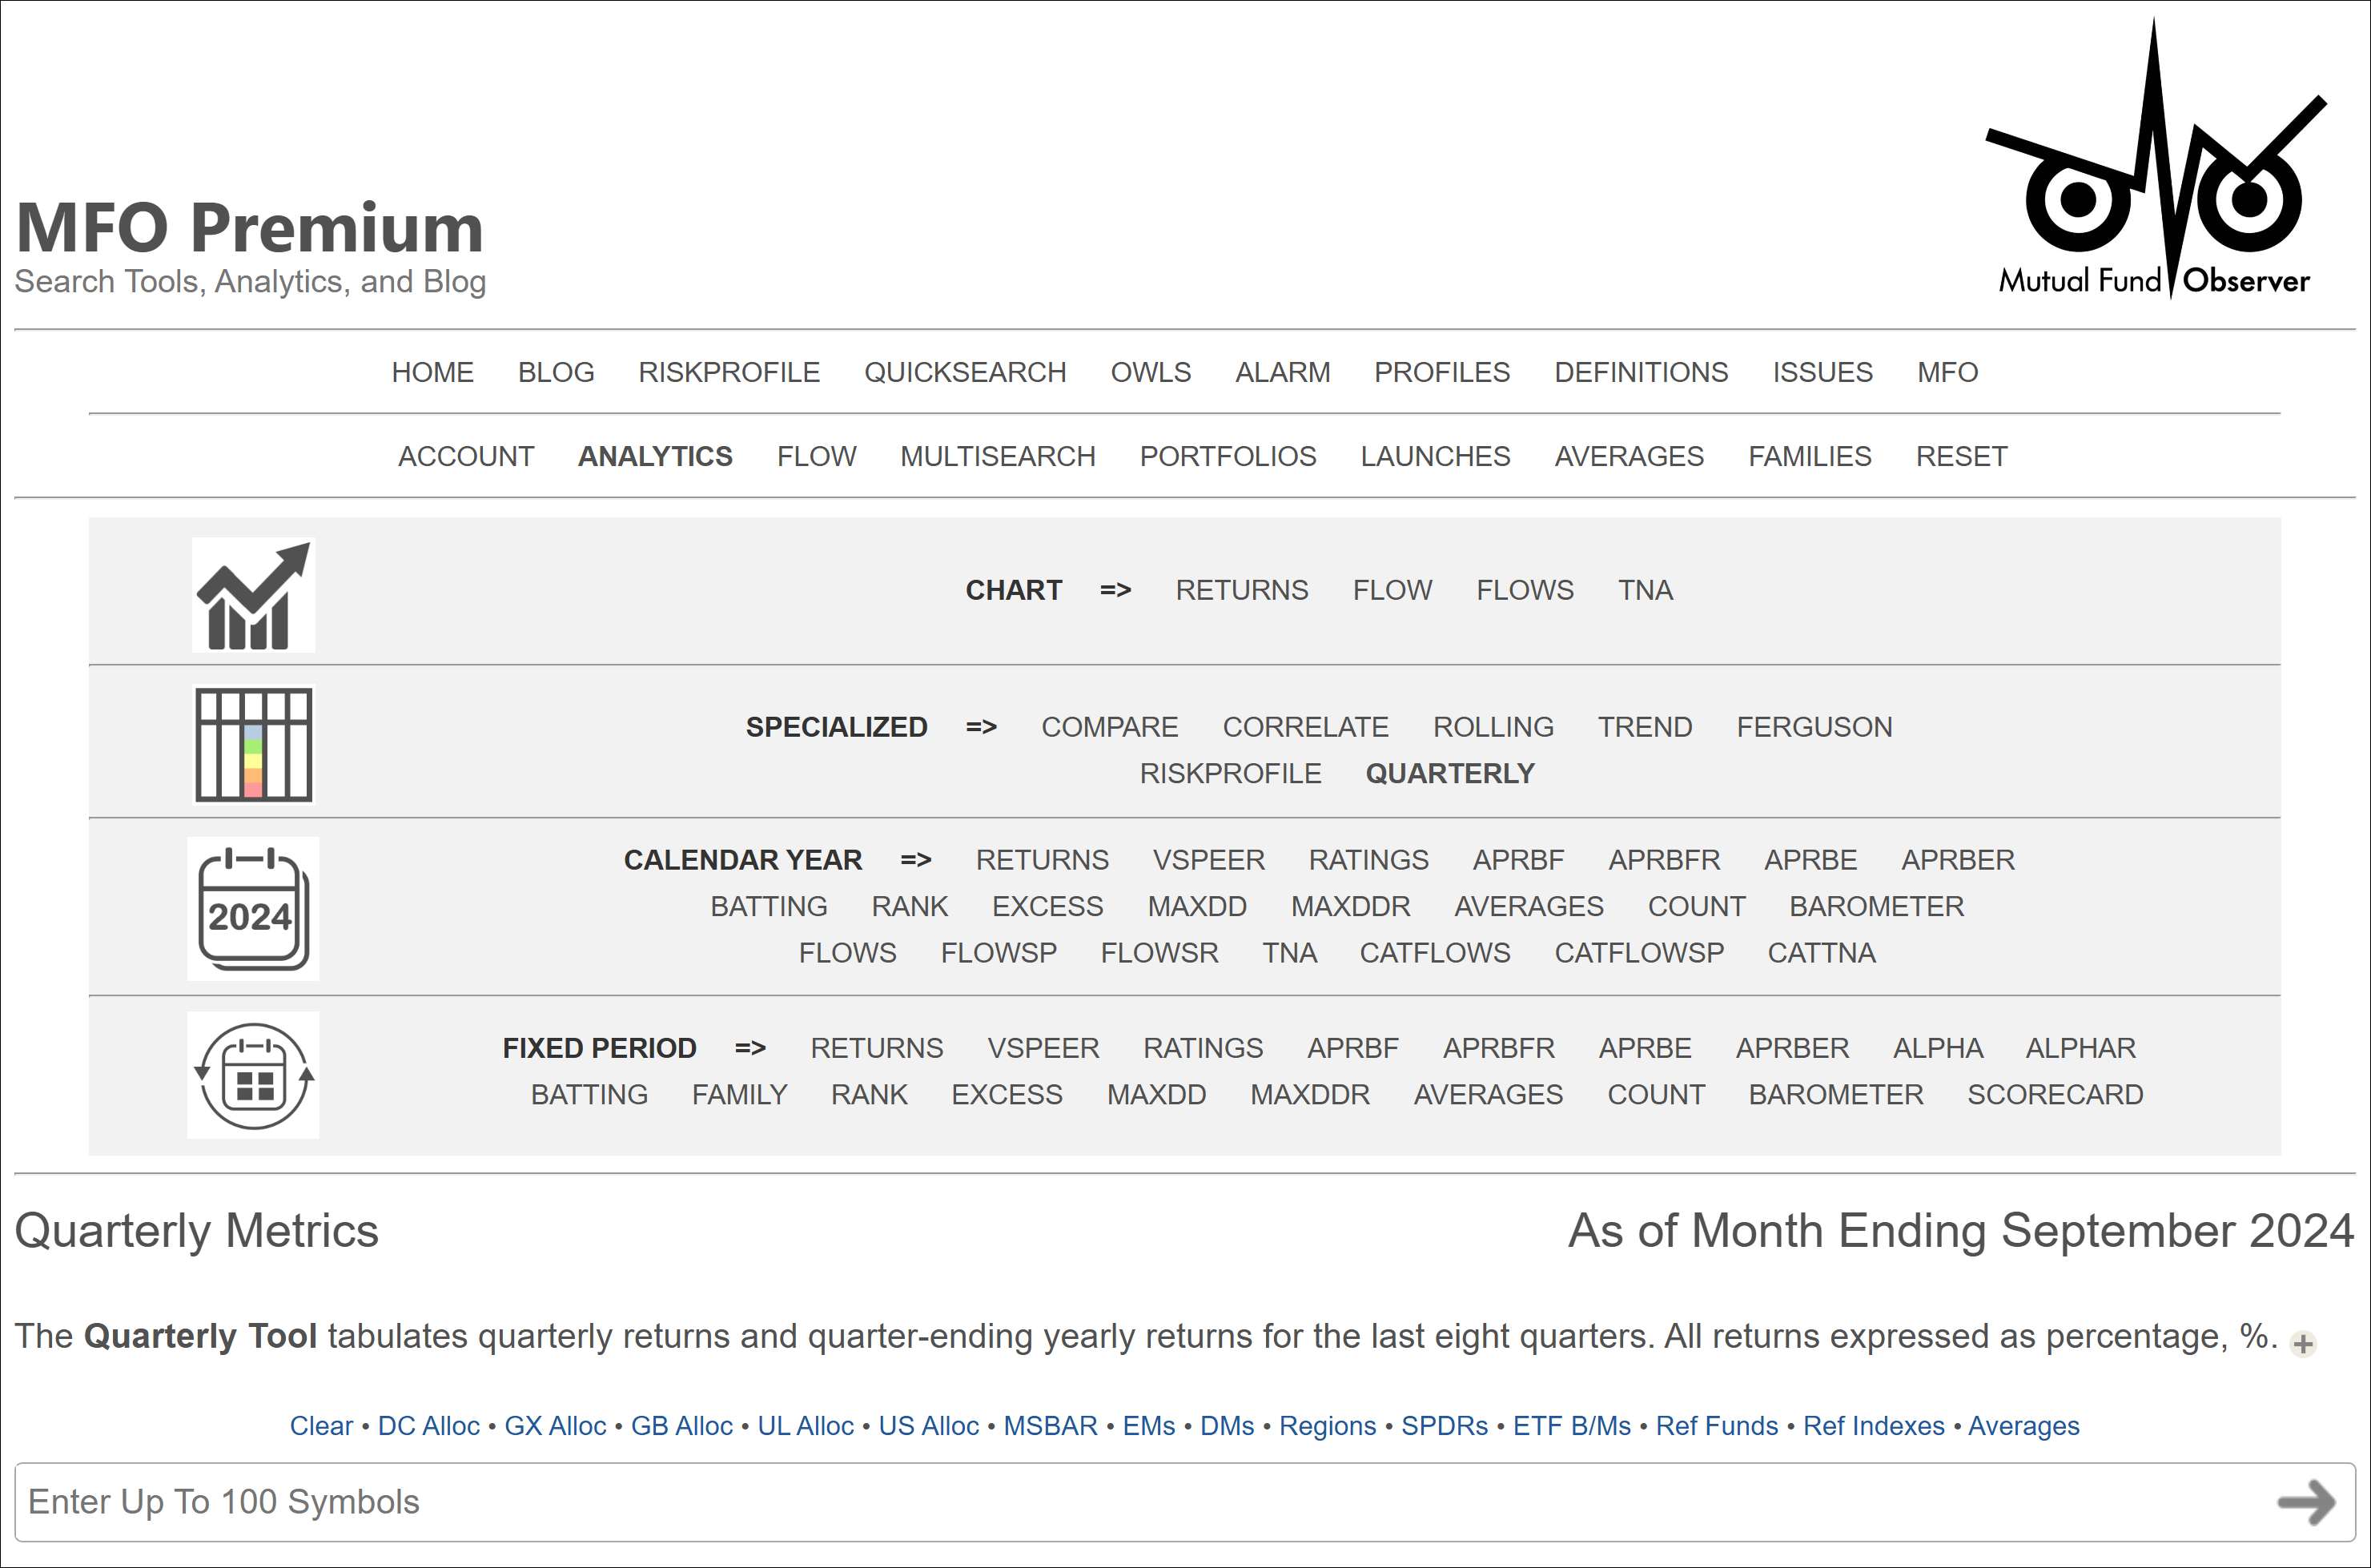
As is typical with subscriber suggestions, we took the opportunity to expand the tool set for all users. The new Quarterly metrics, which include returns and peer ratings for the past 8 quarters, plus attendant quarter-ending annual returns and peer ratings, can be accessed in several ways, the quickest via the Analytics link on the Navigation Bar in the top of any page, as seen in the screenshot below:
Quarterly Tool on MFO Analytics Panel
Users can enter the ticker symbols of particular funds, or use the short-cut links to get quarterlies of say StateStreet Sector ETFs (SPDRs), Morningstar’s Barometer ETFs (3×3 cap/style), or category averages, which come from the Pre-Set Screens in MultiSearch, the site’s main search tool.
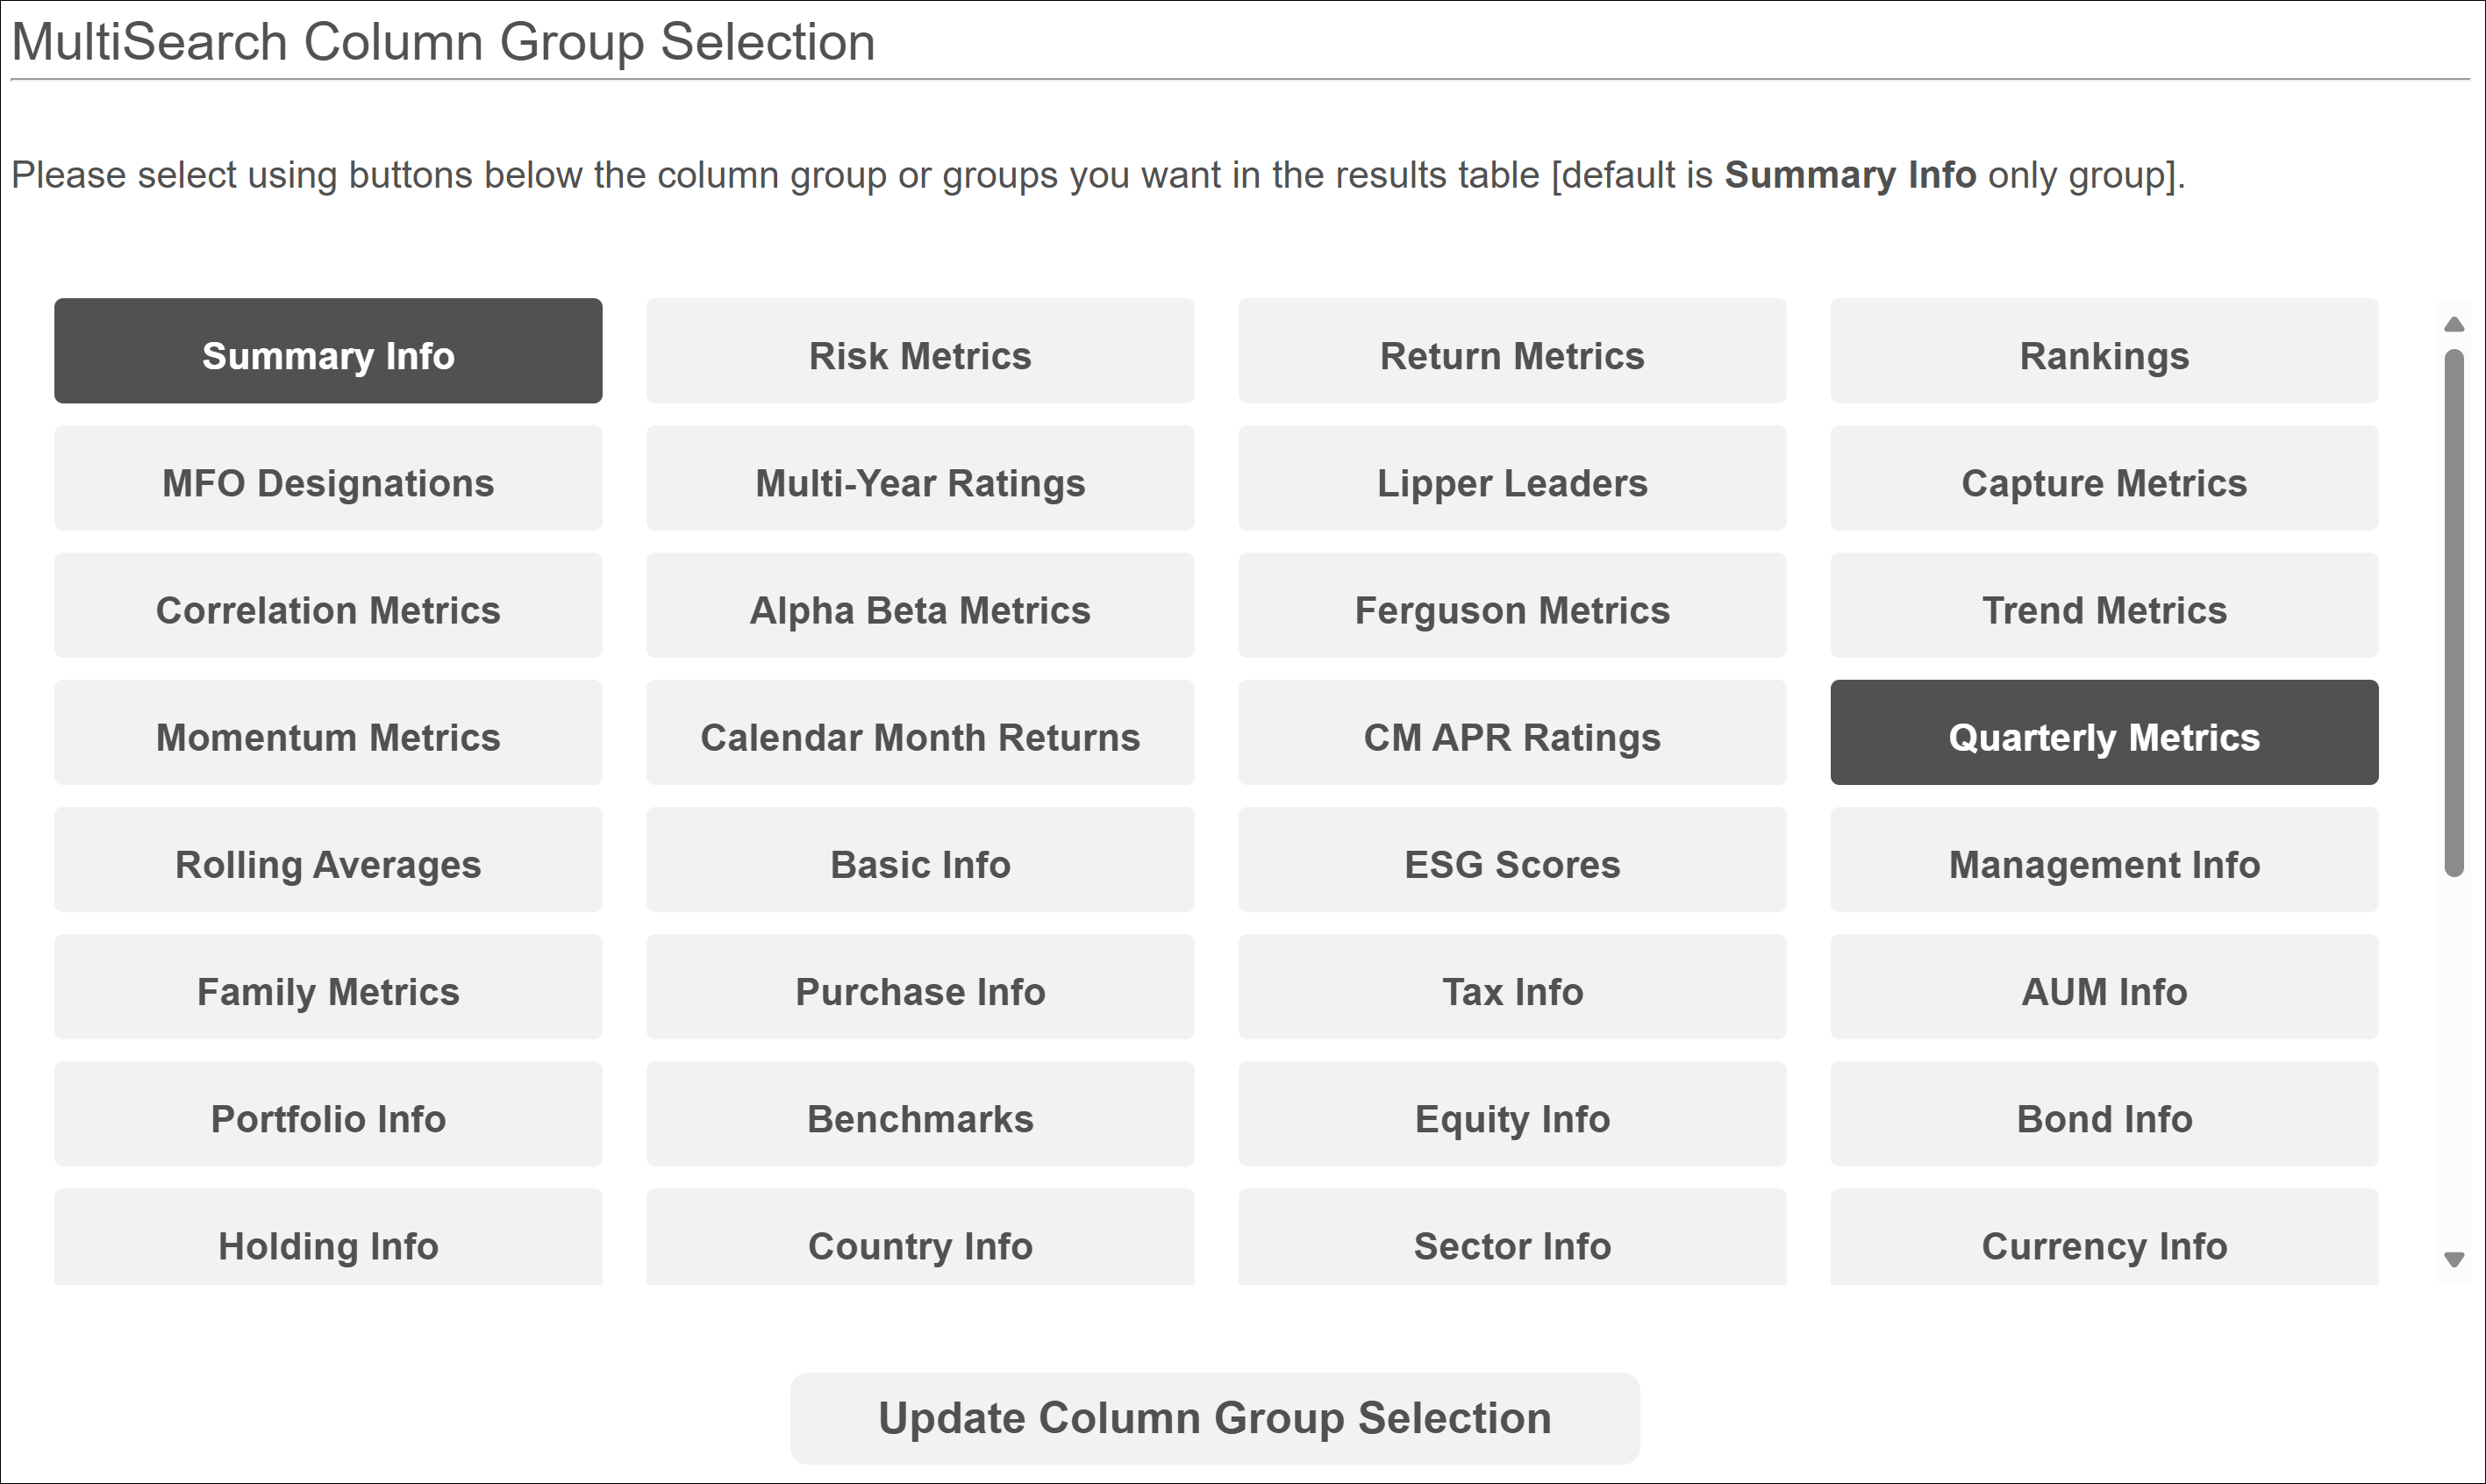
Another way to access the Quarterly Metrics is through MultiSearch. Once search criteria is selected, users can open the Quarterly Metrics via the Group Button, shown here:
Quarterly Group Selection in MultiSearch
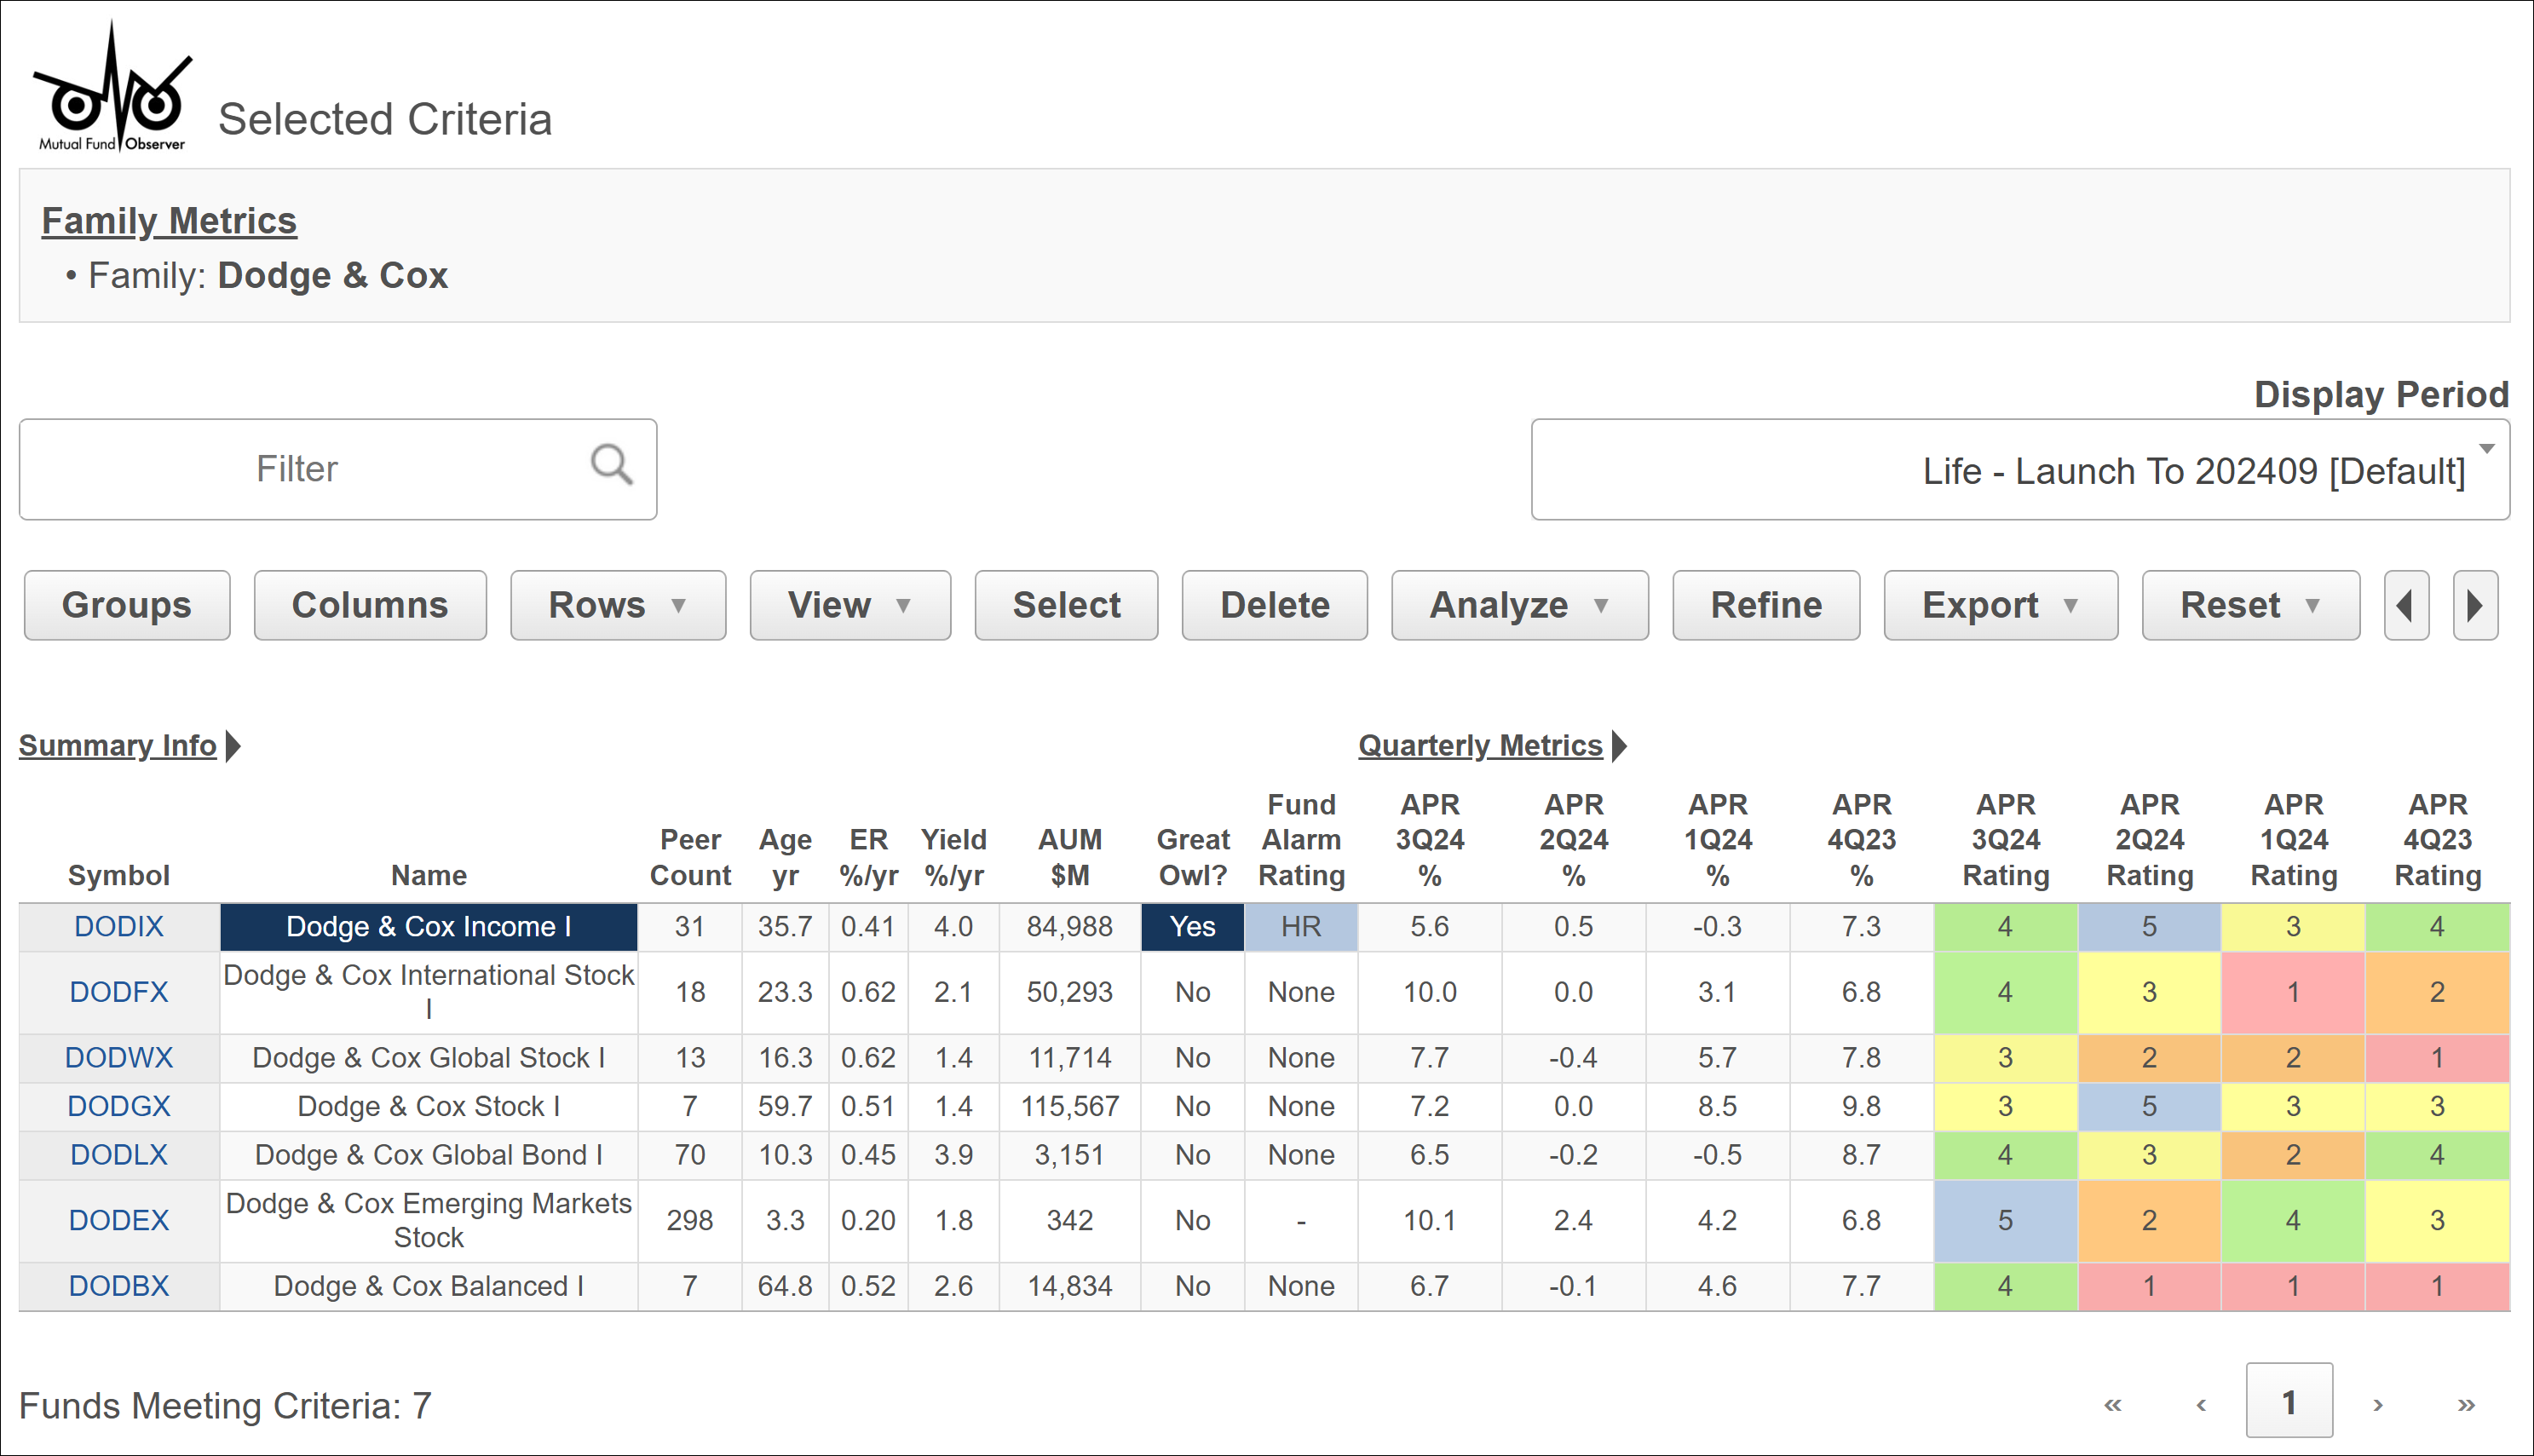
And, finally, here are the new quarterlies, using the Dodge & Cox family funds, for the last four quarters, beginning with the good one that just ended.


