Whether gold volatility is like the stock market? Let us see based on the last 43 years’ data of gold price movement. We always have a misconception that gold will always glitter and price will never go negative. But if study the historical price movement of gold, the results are surprising to us.
Few years back, I wrote a post on a similar note “Gold Price of Rs.18.75 in 1925 to Rs.47000 in 2020 – Should you invest?“. However, I was skeptical about the gold prices I have considered as the post was based on the sharing of WhatsApp university.
This time, I thought to go with valid data. Luckily I found the same from World Gold Council. The date of gold is available from 1979 to 2022. Hence, based on these 43 years’ data, I thought to write a fresh post and see what the results look like.
Rs.1 lakh invested in Gold in 1979 is worth Rs.79,62,196 in 2022!!
Yes, if you have invested Rs.1 lakh in 1979 is worth Rs.79 Lakh. The return on investment is 10.55%. Fantastic returns if we look plainly right? The below graph will show the journey of this Rs.1,00,000 during this 43 years period.
Looks fantastic journey and in fact, a 10.55% return on investment is obviously a wonderful return. However, look into the journey it traveled during these 43 years. Then you will come to know how much high volatile gold is in reality.
For each asset class, there may be some good periods and bad periods. Those who try to highlight the positive or negative will be wise in the selection of data points and arrive at the conclusion that the future returns are also the same as the past.
Hence, to understand the real volatility of the gold, the concept of the rolling return will be handy for us. Also, in fact, there may be very few who are holding the gold for 43 years as an investment. hence, let us try to find out the rolling returns for 1 year, 3 years, 5 years, 10 years, and 20 years period.
Rolling returns mean what if someone purchased the gold and hold it for a year, 3 years, 5 years, 10 years, or 20 years, then what may be the returns during those 43 years periods?
Gold Volatility – Based on 43 Years of History
The data is available from 2nd January 1979 to 12th August 2022. This means 11,380 daily data values for our research. Based on that let us try to visualize the volatility of gold during these 43 years.
1 Yr Rolling Returns
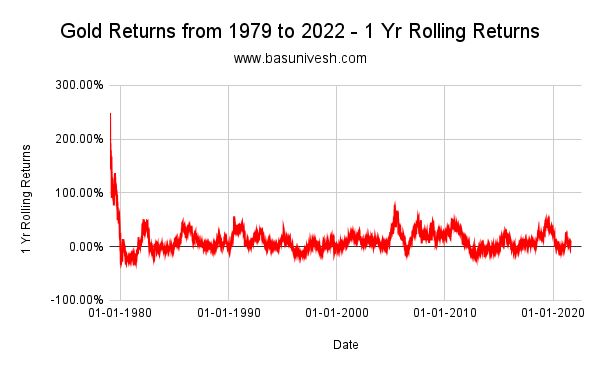
The above chart shows the 1-year rolling returns during the 43 years period. You noticed the wide gap at the initial stage during the 1980s. Not sure whether it is because of some data discrepancies at the World Gold Council side. But let us ignore that wide movement and concentrate on the data post-1980. You noticed that returns vary widely. The maximum return for such a 1-year rolling return is 249% and the minimum is -34.4%. It means during this 43 years period, if one buys and sells the gold for a year, then there are instances like the returns maybe 249% to negative -34.4%. The wide gap with wide volatility.
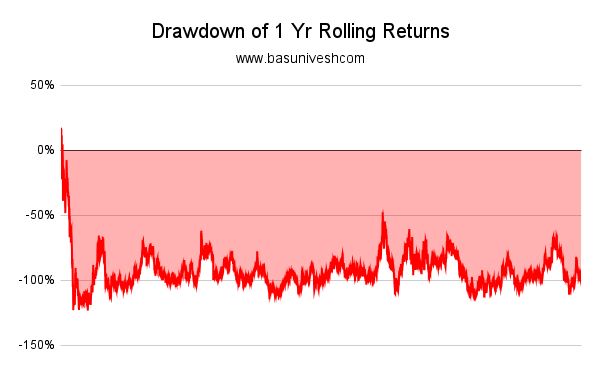
Let us try to find the drawdown of these returns. Drawdown in the sense fall in the returns from its previous year’s peak. This is an also indication of the risk involved in returns.
It may be showing the huge drawdown mainly because of the initial years’ huge uptrend (Not sure… it May be due to data at the world gold council).
3 Yrs Rolling Returns
Let us move on now for 3 years of rolling returns.
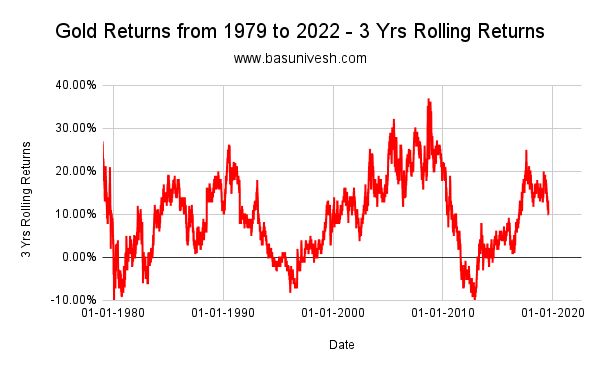
Here also you can visualize the volatility in returns. The maximum return is 36.8% and the minimum returns one might receive due to buying and holding for 3 years during this 43 years period is -10.3%.
The 3-year rolling returns drawdown looks like the below.
5 Yrs Rolling Returns
Let us see the 5 years rolling returns.
If someone is holding the gold for 5 years period, then the maximum return one might generate is 27.8% and the minimum is -10.4%. Hence, there is no great change between 3 years holding and 5 years holding period during these 43 years period.
10 Yrs Rolling Returns
What if someone purchased the gold and held it for 10 years during these 43 years period?
Here too the possibility of negative returns can’t be avoided. The maximum return during this period is 21.3% and the minimum is 0.3% (almost zero). Assume a person who invested in gold for 10 years and the returns are zero. Unimaginable especially based on our strong belief that gold always glitters.
The drawdown of these 10 years’ rolling returns is as below.
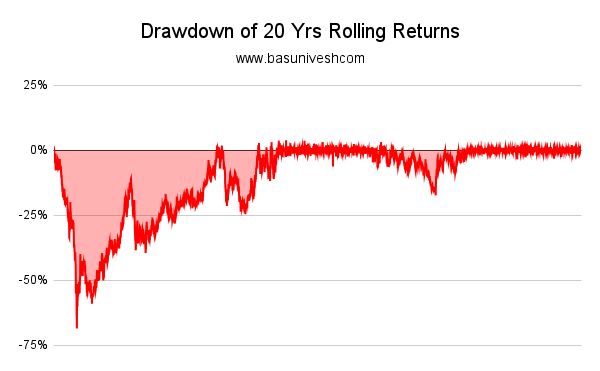
20 Yrs Rolling Returns
If you are a long-term investor like 20 years during these 43 years periods, then what may be the possible up and downs?
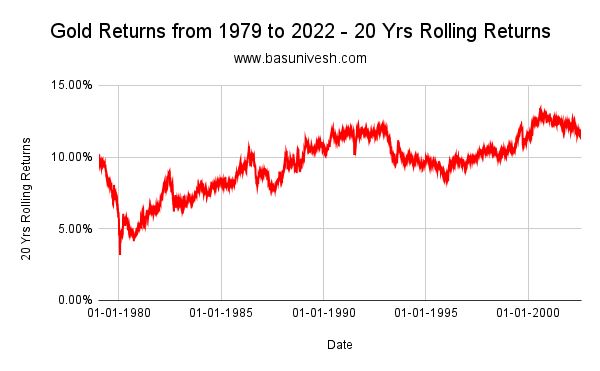
The maximum return was 13.4% and the minimum was 3.2%. Even after holding for around 20 years, there are examples that the returns may not even beat the inflation or your bank’s FD rates.
The drawdown looks like the below.
The volatility of the Gold – Worth investing?
I am not saying you must not invest or forcing you to invest based on past returns. However, the idea to write this post is that gold is volatile like the stock market and there are instances like negative to zero returns even after holding for the long term.
Hence, come out from the strong belief that gold always glitters and one must invest. If you can digest the volatility and fine with low returns than the equity, then you can go ahead and invest. Otherwise, gold as an asset class can be ignored.
Note:- I tried my best to avoid the errors and also tried my best to be accurate. There may be some small mistakes at my end. But not major mistakes.


