We are in a classic late stage of the business cycle with the Federal Reserve raising rates to reduce demand in order to control inflation. What is different this time is that the inflation is likely to be higher for longer because it is a global issue resulting from a combination of factors, including COVID-related supply chain disruptions and related stimulus, an extended period of low-interest rates and easy monetary policy, and the Russian invasion of Ukraine that, in addition to being a tragic loss of lives, also disrupted supply chains. I look at the base case of the Federal Reserve raising the Fed Funds (FF) target rate in November and December and holding the rate relatively constant next year. The next six to nine months are key to determining if inflation is falling, the impact of rising rates on the economy, and the probability and severity of an anticipated recession.
This article is divided into four sections:
Economy (Employment, Inflation, Consumers, Earnings)
Federal Reserve (Rates, Yield Curve, Recession)
Risks (Solvency, Valuations)
Strategy (Treasury Ladders, Bond Funds, Stock Market)
Economy
Key Point: The economy is relatively strong but slowing. The Federal Funds rate is significantly below the inflation rate. The Federal Reserve will most likely continue raising rates aggressively this year and slow down increases next year until inflation moderates.
In “Odds of Recession in Next 12 Months Now 63 Percent in Survey of Economists,” Zach Schonfeld, at The Hill, reported that 63% of economists in a Wall Street Journal survey believe there will be a recession starting in the next twelve months. Personal Consumption Expenditures (PCE) make up about 68% of the gross domestic product. Advance Retail Sales (RSXFS) provide useful insight into PCE. These two metrics have been relatively flat since June and suggest that the economy is slowing, but a recession is not starting during the next few months. YCharts has a chart of recession probabilities showing that the probability of a recession in August 2023 is twenty-five percent.
The spread between inflation and the Federal Funds rate is near a fifty-year high. The Personal Consumption Expenditures Price Index (PCEPI) available in the St. Louis Federal Reserve database has been relatively flat for the three months ending in August. Howard Schneider at Reuters reported in “Exclusive-Fed’s Bullard Favors’ Frontloading’ Rate Hikes Now, With Wait-And-See Stance In 2023,” that St. Louis Fed President James Bullard believes rate hikes should be front-loaded to contain inflation, and the estimates of recession risk may be distorted, in part by inflation.
“Smells Like Recession: Fitch Says an Early ’90s-Style Slowdown Is Just Around the Corner” in Fortune by Prarthana Prakash describes rating agency Fitch’s projection that the gross domestic growth will be a low 0.5% next year. Fitch expects a short, mild recession because the financial system is in relatively good shape. Azhar Igbal and Nicole Cervi at Wells Fargo describe an accurate method of estimating the severity of a recession in “One Spread to Rule Them All: Is Recession Coming?”. They conclude, “if the 10-year/1-year spread is inverted for 12 consecutive months or longer, there is an 80% chance that the upcoming recession will be longer than historical standards.” This metric is not signaling a severe recession but is worth monitoring over the next six to nine months.
Federal Reserve
Key Point: The short end of the yield curve will be a key indicator of the timing of the Federal Fund rate raises and cuts as well as the severity of the next recession.
The mandates of the Federal Reserve are often oversimplified to maintaining full employment and low inflation, but there are additional responsibilities of ensuring the safety and soundness of the nation’s banking and financial system, protecting the credit rights of consumers, maintaining the stability of the financial system, and containing systemic risk in financial markets among other financial services. These can be found in more detail at the Board of Governors of the Federal Reserve System.
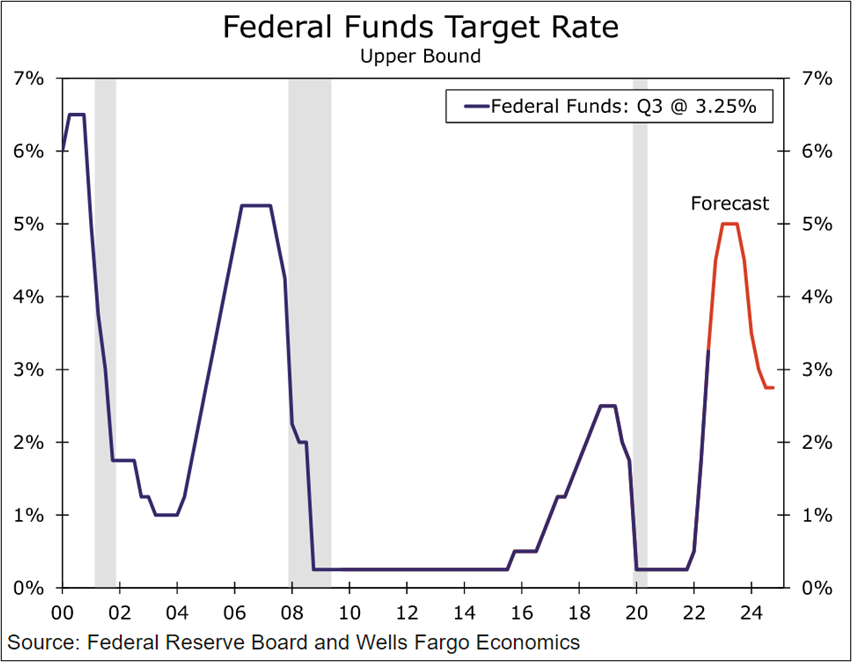
The Federal Funds rate is the primary tool of the Federal Reserve to achieve its objectives. It is set by the Federal Open Market Committee (FOMC) and is the rate at which commercial banks borrow and lend their excess reserves to each other overnight. The median forecast from the September FOMC is to raise the Fed Funds rate to 4.4% by the end of the year and plateau at 4.6% next year without rate cuts until 2024. Wells Fargo provided its “US Economic Outlook: October 2022” and updated its forecast for two rate hikes before the end of the year and two smaller ones in the first quarter, as shown in Figure #1.
Figure #1: Wells Fargo Projection of Federal Funds Rates
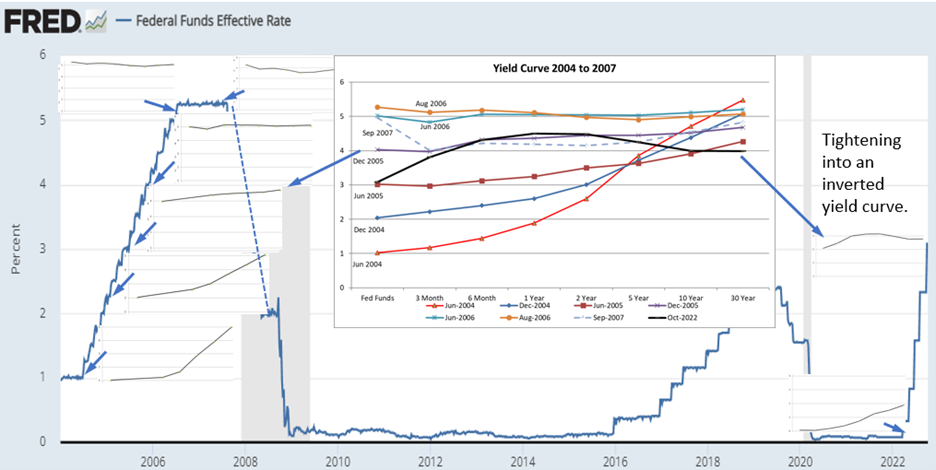
Figure #2 contains a comparison of what the yield curve was doing during the 2004 to 2007 rate hikes in six-month increments compared to 2022. The inset in the middle shows the earlier yield curves (thin lines) to the current yield curve (thick black line). The Federal Reserve continued to hike rates until longer duration rates were flat, with the Federal Funds (FF) rate around July 2006. The rate was held relatively constant through September 2007, when the yield curve became strongly inverted, and the Fed began lowering the FF rate in November 2007. Currently, the short end of the yield curve is not inverted, and the Fed is tightening with the longer end of the yield curve inverted.
Figure #2: Federal Funds Rate Changes and Yield Curves
Source: Created by the Author Using the St Louis Federal Reserve Database (FRED)
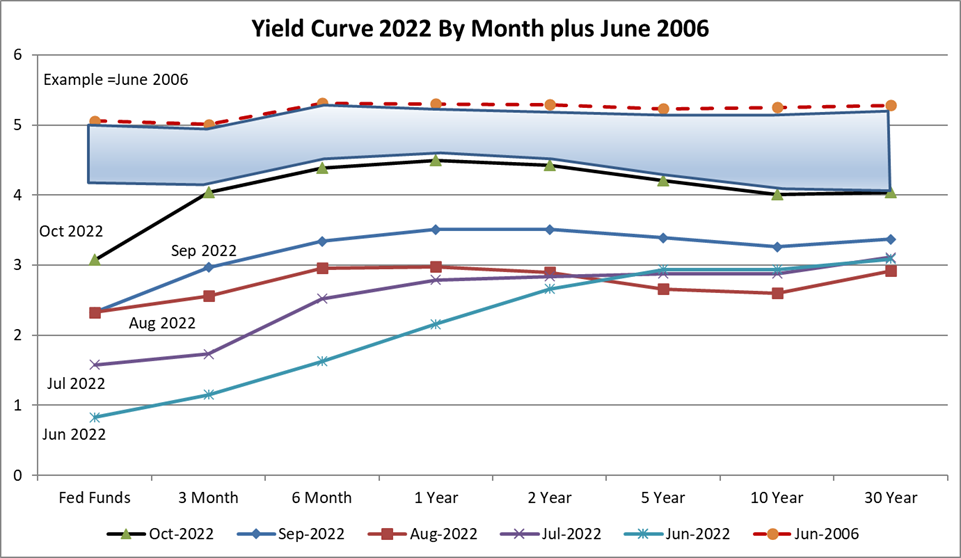
I created Figure #3 to show a range of likely interest rates along the yield curve before the curve fully inverts, warning of an imminent recession. The blue-shaded area lies between the current yield curve and the yield curve as of June 2006. I expect the Federal Funds rate to rise close to 4.4% by the end of this year and possibly to 5% by mid-2023. Intermediate (one year to five years) rates may be close to plateauing. After the next two rate hikes, this year may be a good time to extend the duration of Treasury ladders into the two-to-five-year range. When the short end of the yield curve inverts, the risk of recession rises, and the Federal Reserve is likely to contemplate easing rates.
Figure #3: 2022 Yield Curves with Possible Range of 2023 Rates
Source: Created by the Author Using the St Louis Federal Reserve Database (FRED)
Source: Created by the Author Using the St Louis Federal Reserve Database (FRED)
Risks
Key Point: Solvency of companies with low-profit margins and high valuations are two risks examined.
Zombie companies are those that don’t generate enough profits to service their debts, and with rising borrowing costs for high-yield debt, the number of zombie companies is increasing. Giovanni Favara, Camelia Minoiu, and Ander Perez-Orive at the Federal Reserve estimate in “US Zombie Firms: How Many and How Consequential?” that in 2020 approximately nine percent of public companies were zombies. According to Will Daniel at Fortune, David Trainer, the CEO of the investment research firm New Constructs, believes there are now roughly 300 publicly-traded zombie companies. The number of zombie companies may now be around 13%, as estimated by Goldman Sachs. The American Bankruptcy Institute shows that Commercial Chapter 11 Bankruptcies have been rising since May compared to last year.
John Butters, Vice President and Senior Earnings Analyst at FactSet, updated the “S&P 500 Earnings Season Update” on October 21st, with twenty percent of the companies reporting actual results. The blended earnings results for those that have reported and estimates for the remaining companies for the earnings growth rate for the third quarter is 1.5% compared to 2.8% at the end of the third quarter (September 30th). For perspective, Multipli estimates that the price-to-earnings ratio of the S&P500 has fallen from thirty-six percent at the beginning of 2021 to twenty now. It is still historically high and falling rapidly.
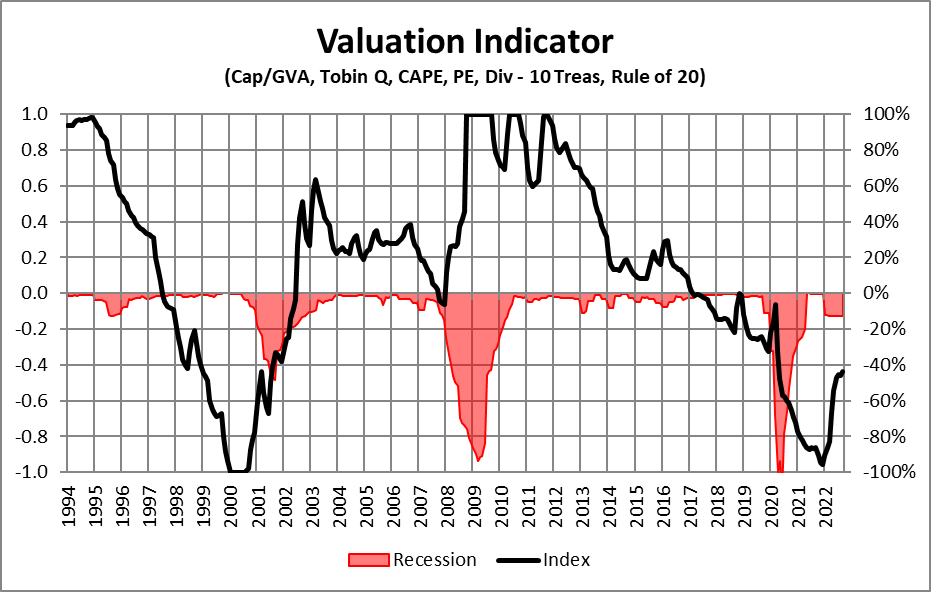
In Figure #4, I composite several popular methods of estimating stock market valuations, including market capitalization to gross value added, Tobin Q Ratio, Cyclically Adjusted Price to Earnings Ratio, Dividends in relationship to the 10-year treasury, and the Rule of 20. A strongly positive value is favorable, and a strongly negative value is unfavorable. These various methods take into account economic productivity, asset replacement costs, business earnings cycles, interest rates, and inflation.
Figure #4: Stock Market Valuations
Source: Created by the Author Using the St Louis Federal Reserve Database and S&P Dow Jones Indices
Both the bear markets in 2000 and 2008 were severe. The recession associated with Technology was mild, and the recession associated with the housing bubble and financial crisis was severe. Whether the US experiences a mild or severe recession, I believe the bear market has further to extend as earnings disappoint and valuations compress.
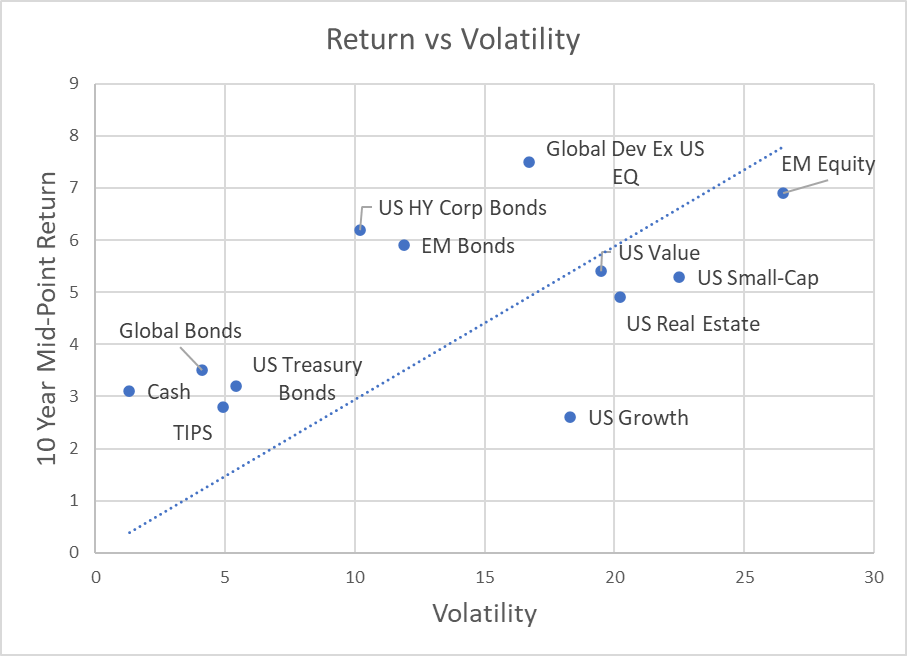
In their Monthly Economic Outlook, Vanguard estimates that US large-cap equity returns will average a historically low 4.0% to 6.0% over the next decade. If correct, a five percent yield on US Treasuries is very attractive. In Figure #5, I used Vanguard’s mid-point estimate of 10-year returns and volatility to show returns versus volatility. The chart shows that Global Developed Markets have higher potential returns than US stocks which is due to valuations.
Figure #5: Vanguard Estimated 10-Year Returns vs Volatility
Source: Created by the author using Vanguard Monthly Economic Outlook
Strategy
Key Point: The first half of 2023 offers an opportunity to extend the duration of fixed income. A recession and associated bear market offer opportunities to rebalance to bring stock allocations up to target and to perform a Roth Conversion.
My target allocation to equities is fifty percent within a range of thirty-five to sixty-five percent depending upon the business cycle, and is currently near my minimum of thirty-five percent. My allocation to money market funds, short-term treasuries, and short-term certificates of deposit has increased to over twenty-five percent. I have timed maturities of fixed-income ladders to provide a steady flow of money to reinvest depending upon market conditions.
Here are some of the funds that I favor over the next year after satisfying my needs for buying fixed income.
- Columbia Thermostat (CTFAX/COTZX). As of September 30th, it had about 35% allocated to stocks, up from 10% on August 15th. The further stocks fall, the more it allocates to stocks which may work out well if a recession does occur next year. The weighted average bond maturity is 7.9 years.
- Of the traditional mixed asset funds, I like actively managed Vanguard Global Wellesley (VGYAX). It is a global mixed asset value-oriented fund with a stock-to-bond ratio of about 40/60 and about sixteen percent allocated to US equities. I plan on increasing allocations as the interest rate increases slowly.
- Fidelity New Millennium (FMILX, FMIL). It has lost 7% year-to-date compared to 20% for the S&P 500. I will increase allocations when the market falls further in 2023. For more information, please see Fidelity Actively Managed New Millennium ETF (FMIL) in the MFO September Newsletter.
- If a recession does occur next year, then I will be adding growth and technology funds as well as beat-down funds as the yield curve indicates a recovery is on the horizon.
Closing
I keep a ten-million-dollar bill from the Reserve Bank of Zimbabwe in my office to remind me of the potential dangers of inflation. The next six to nine months will provide insight into inflation, the probability of a recession occurring, and the severity of the recession.
As I wrapped up this article, I ran across “JPMorgan President: Recession’ Price to Pay’ to Beat Inflation” in Newsmax Finance. The article is about JPMorgan President Daniel Pinto, who grew up in Argentina and experienced hyperinflation. He believes that the Federal Reserve is following the correct path of monetary tightening. Mr. Pinto believes that a recession will occur, but the severity remains in question. He concludes earnings expectations are too high, as well as some market valuations and does not believe that market is bottoming out yet.


