Nifty 50 Vs Gold – Which is the best investment? As gold price touched an all-time high and Nifty is in sideways for few years, obliviously many have this question. Let us try to understand this by looking at the past 24 years of Nifty 50 TRI and Gold data.
Why I have taken only 24 years of data and why not more or less? As Nifty 50 TRI (Total Return Index) data is available from 30th June 1999, I have considered the data from 30th June 1999 to 21st April 2023. Again you may ask questions like why 21st April 2023 as the data is available for up to 28th April 2023 (based on the date of writing this article). The reason is I have taken the daily gold price data from World Gold Council. According to their latest updated data, the last date is the 21st of April 2023. Hence, to make sure that there should be uniformity, I have considered these start and end dates for our discussion.
To ensure uniformity of data, I considered only the values where both Nifty and Gold had data available. This was necessary as there were a few days of World Gold Council data when Nifty data was unavailable due to holidays.
Now, we have daily data points of 5926 days. Considering this, let us start to find out the answer like Nifty Vs Gold – Which is the best investment?
Nifty 50 Vs Gold – Which is the best investment?
Whether comparison of Nifty 50 Vs Gold is worth considering? As per me, NO. However, when it comes to investment, many try to compare equity vs gold. Hence, for that purpose, I have taken this comparison. Otherwise, you notice later on that both have different natures when it comes to volatility and return possibilities.
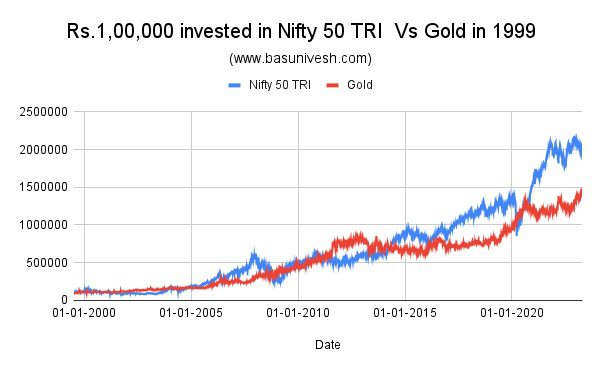
# What if someone invested Rs.1,00,000 in Nifty 50 or Gold in 1999?
Let us try to find out the value of if someone invested Rs.1,00,000 in Nifty 50 and Gold in 1999.
You noticed that Rs.1,00,000 invested in Nifty 50 and Gold have a huge marginal difference. The final value for Nifty 50 is Rs.20,41,960. For gold, it is Rs.14,31,903. It is surprising Rs.6,10,057 or almost 42% higher value than Gold. Hold on….!! Don’t rejoice. Instead, let us try to find the journey of these 24 years and what was the drawdown during these 24 years of journey.
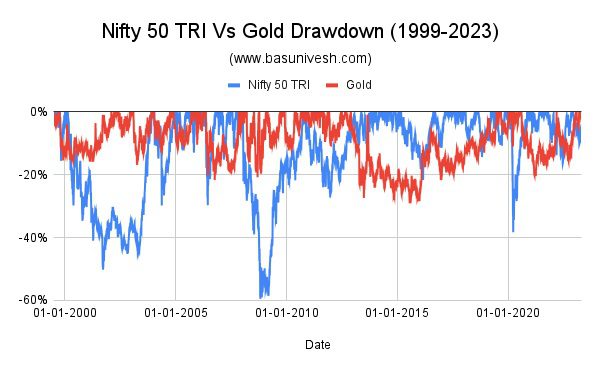
Drawdown is the difference between the highest point of the investment’s value and the lowest point of its value during a specific time period. For example, if an investment’s highest value was Rs.1,00,000 and its lowest value during a market downturn was Rs.80,000, the drawdown would be Rs.20,000 or 20%. In other words, drawdown is the amount of loss that an investor would experience if they had invested at the highest point and sold at the lowest point. It is an important measure of risk in investment management and is used by investors to assess the potential downside of an investment.
You have to look for the drawdown chart of the above. You noticed that even though point-to-point results look fantastic (from 1999 to 2023), the journey for equity investors is not smooth. There were situations where the equity portfolio may be down for almost around more than 50% (It is 59.5% if we say precisely) from its peak value.
Same way even though the fall in the value of gold may not be so much sharp, you noticed that the drawdown for gold is also to the max of 29.10%.
This shows that even though the Nifty 50 looks attractive when we compare the point-to-point returns, it comes with more volatility than gold. But do remember that gold is also not SAFE as many think. Instead, there is a drop of around 29% from its highest value. Hence, both Nifty and Gold are volatile in nature.
Let us now try to find out the return possibilities for the investors of Nifty and Gold during this period of 1999-2023 with 1 Yr, 3 Yrs, 5 Yrs, and 10 Yrs Rolling Returns. This will give us more clarity about the volatility of both assets.
# One Year Rolling Return of Nifty 50 Vs Gold from 1999 – 2023
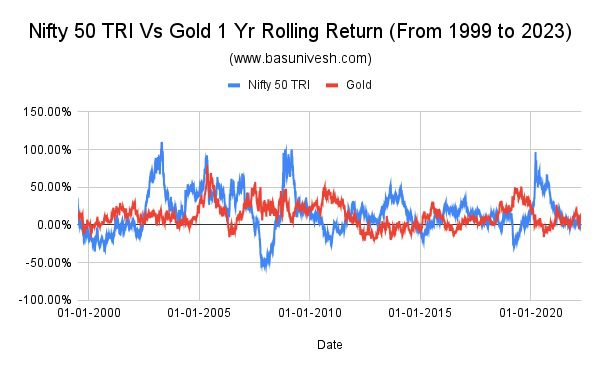
What if someone is buying and selling in Nifty 50 and Gold by holding it just for a year? Then what may be the return possibilities?
Have you noticed a cycle? Both look volatile but again yes, equity looks more volatile. The maximum return for Nifty TRI is 110% and the lowest is -55%. The same way for gold, the maximum is 79% and the minimum is -21%. The average return for Nifty is 16% and for Gold, it is 12.45%.
# Three Years Rolling Return of Nifty 50 Vs Gold from 1999 – 2023
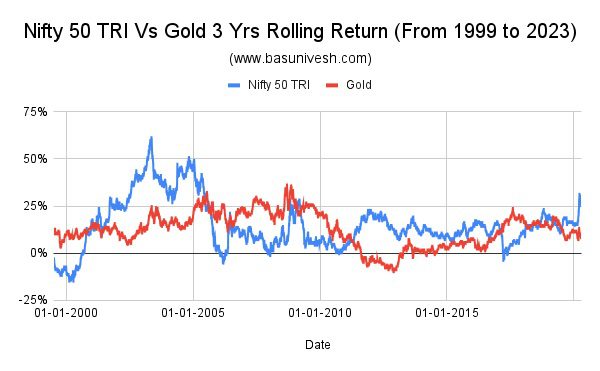
Let us try to find the answer for three years of rolling returns.
You noticed that even though volatility is reduced to a certain extent if your holding period is around 3 years during these 24 years, but still the probability of negative returns can’t be avoided in both assets.
The maximum return for Nifty 50 is 62%, the minimum is -15%, and the average return is 15%. Same way, for gold the maximum return is 37%, the minimum is -10% and the average return is 12.47%.
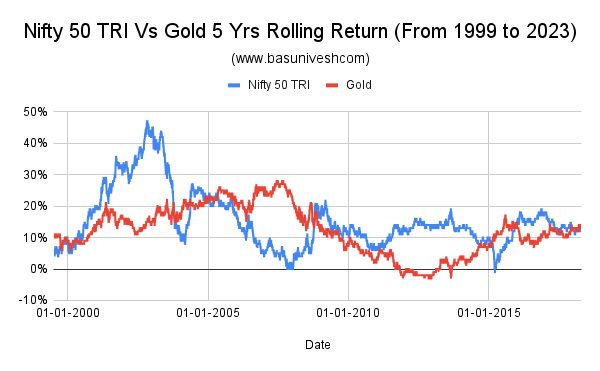
# Five Years Rolling Return of Nifty 50 Vs Gold from 1999 – 2023
Let us try to find the answer for five years of rolling returns. This means if you are investing in Nifty or Gold for 5 years period during these 24 years of history, then what may be the return possibilities?
You noticed that even though volatility is reduced to a certain extent if your holding period is around 5 years during these 24 years, surprisingly the probability of negative returns can’t be avoided in gold than equity.
The maximum return for Nifty 50 is 47%, the minimum is -1%, and the average return is 15%. Same way, for gold the maximum return is 28%, the minimum is -3% and the average return is 12%.
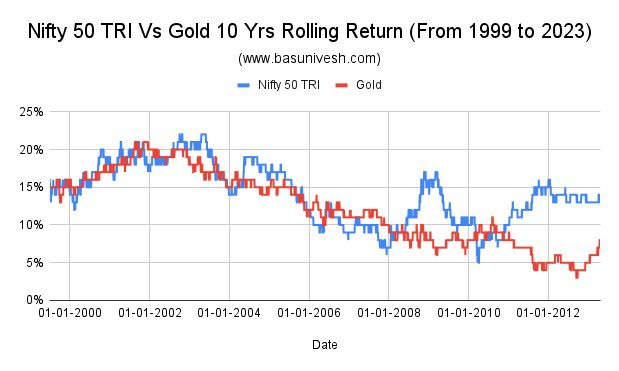
# Five Years Rolling Return of Nifty 50 Vs Gold from 1999 – 2023
Let us try to find the answer for five years of rolling returns. This means if you are investing in Nifty or Gold for 10 years period during these 24 years of history, then what may be the return possibilities?
You noticed that even though volatility is reduced to a certain extent if your holding period is around 10 years during these 24 years, surprisingly the probability of less returns can’t be avoided in gold than equity.
The maximum return for Nifty 50 is 22%, the minimum is 5%, and the average return is 14%. Same way, for gold the maximum return is 21%, the minimum is 3% and the average return is 12%.
# Nifty 50 Vs Gold – What we can conclude?
- Considering all the above results, one thing which is emerged from the past 24 years of data is even though equity is volatile in nature, the volatility will reduce if your holding period is long-term.
- Strangely for those who have a firm belief that gold will always glitter, the return possibilities are less than equity even after holding the gold for 5 years and 10 years period. Also, the possibility of low return is more in terms of gold than equity if your holding period is 5 years or 10 years.
- But you will surely notice the negative correlation between gold and equity performance. This means when the equity market is underperforming, then gold will shine and vice versa. But it does not mean that gold is SAFE and LESS VOLATILE.
Considering all these above aspects, we can conclude that both assets are volatile in nature. They have negative co-relation between them. But believing that gold is less volatile than equity is MYTH. The rest is left with you to decide.
Note – This article is meant for educational purposes. In no way I am recommending either of these assets upfront as investment advice. Also, along with Nifty 50, if you add the Nifty Next 50, Nifty Midcap, or Nifty Small cap, the results may vary. For simplicity purpose and calculation purposes, I have considered the single Index i.e. Nifty 50
Refer to our earliest posts on Gold –


