A reader asks after looking at the Sensex chart in the article – Do not stop or redeem your equity investments! Now is the best time to invest! (also shown below), “Why did you draw the Sensex chart in logarithmic scale? What is the benefit of doing so?”
Let us start with what a logarithm is. We all know what “to the power of” means. That is 10 to the power of 2 = 10^2 = 10 x 10 = 100. This is also known as exponentiation. The logarithm is the opposite of exponentiation.
Think of these maths operations as some bread toaster. You put in the number 10, press 2, enter the “power of” button, and out pops 100. Now imagine doing the reverse. You push in 100 and enter the “logarithm of” button, and out pops 2. Let us see how this is useful.
Suppose I have the numbers 10, 100, 1000, 10000, and 100000. The difference between adjacent numbers keeps increasing more and more. If we plot this in a normal graph, it would look like this.
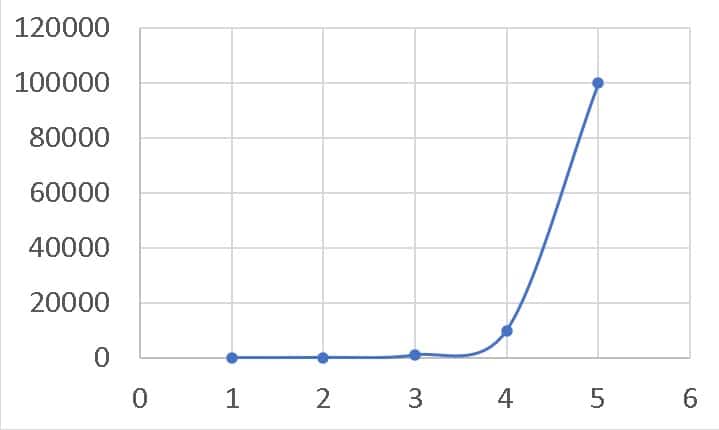
Notice that because the span of numbers goes from 10 to 100000, the variation in the last few numbers completely masks the variation in the first few numbers. The log chart lets us view all the numbers on the same scale.
Notice that 100 is ten times more than 10. 1000 is ten times more than 100 and so. A property of the logarithm allows us to view this scaling immediately.
Log (A/B) = Log (A) – Log (B)
Now, we have,
Log(10) = 1
Log(100)= 2
Log(1000= 3
Log(10000)= 4
Log(100000)= 5
So Log(100/10) = Log (100)- Log (10) = 2-1 = 1.
The difference between adjacent numbers in log is the same (for this set of numbers) = 1. So the plot in the log scale will look like this.
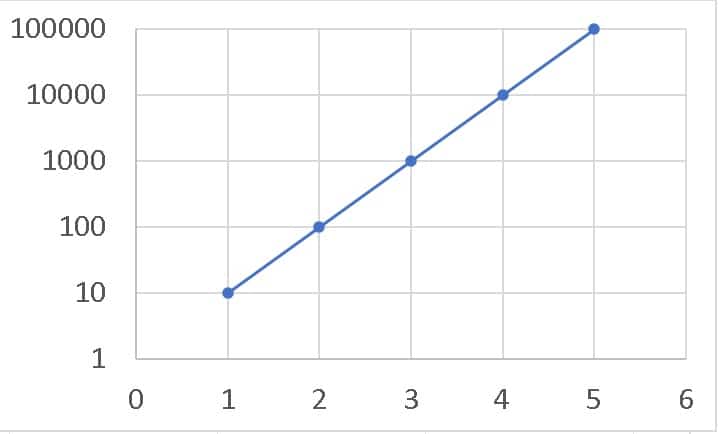
Now the variations in both the big and small numbers can be seen, and the spacing between 10 and 100 is the same as the spacing between 1000 and 100. This is not possible on a normal scale. Now let us see this in action.
This is the Sensex price movement from April 1973 to March 2023.
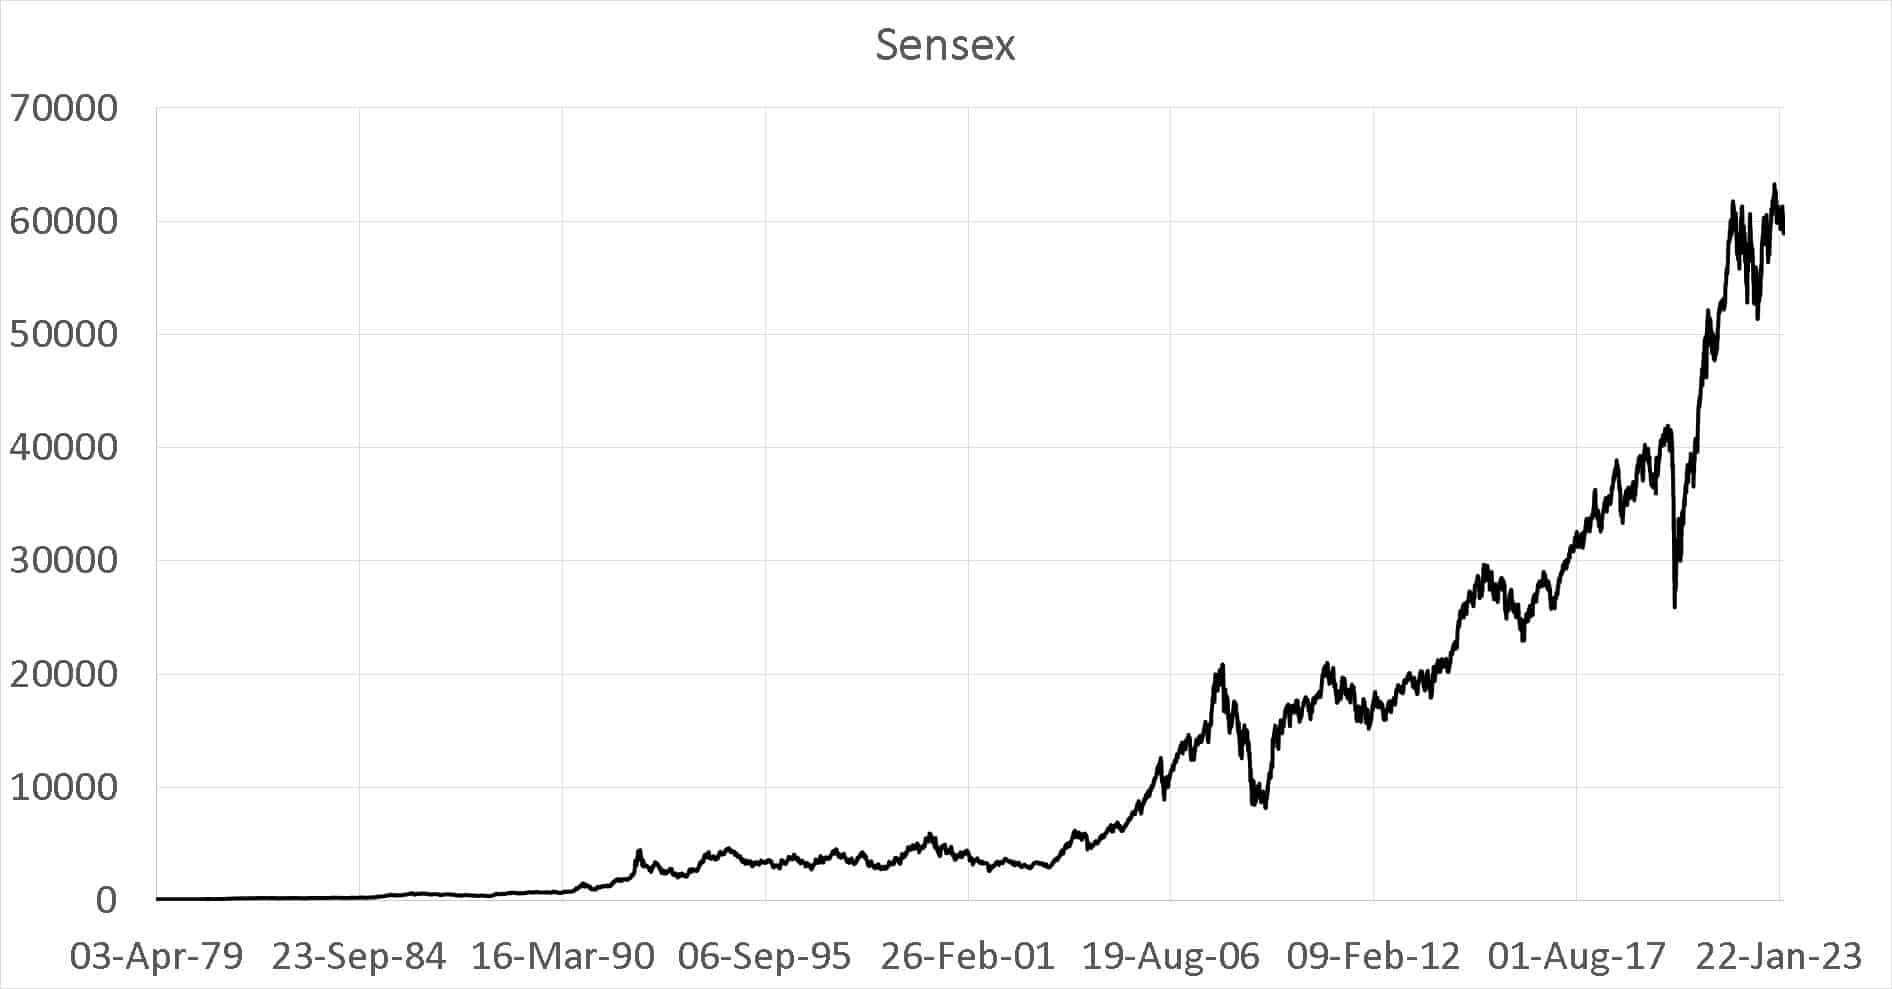
The movement in the 1970s,80s and 90s are completely masked by the movement thereafter. The Sensex in log scale (with sideways markets shown in red) looks completely different.
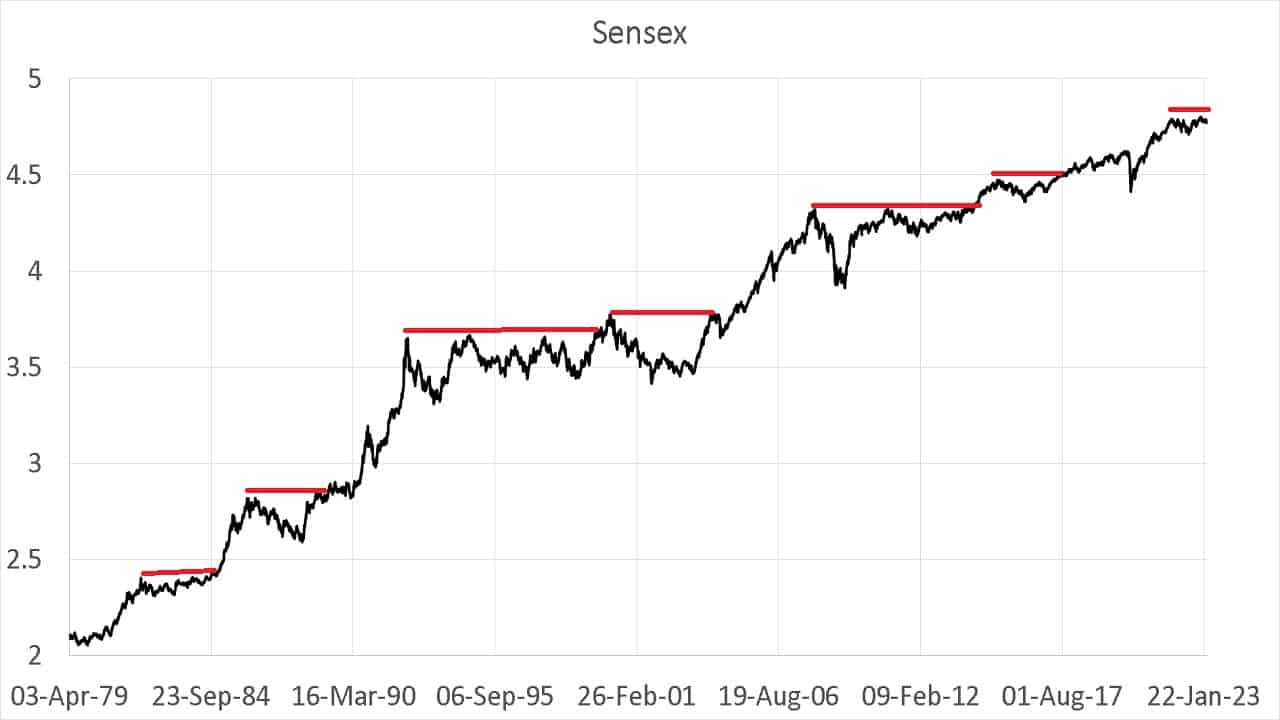
The features in the early days of the Sensex are clearly seen and more important, we can compare changes across decades. A 0.5 log scale movement in the 1980s is identical to the same quantum leap anytime after.
Here is an extract from our previous article – Are you ready to climb the Sensex Staircase?!
In order to get a sense of the features, I have added several indicators (drawn with the full benefit of hindsight – only for illustration).
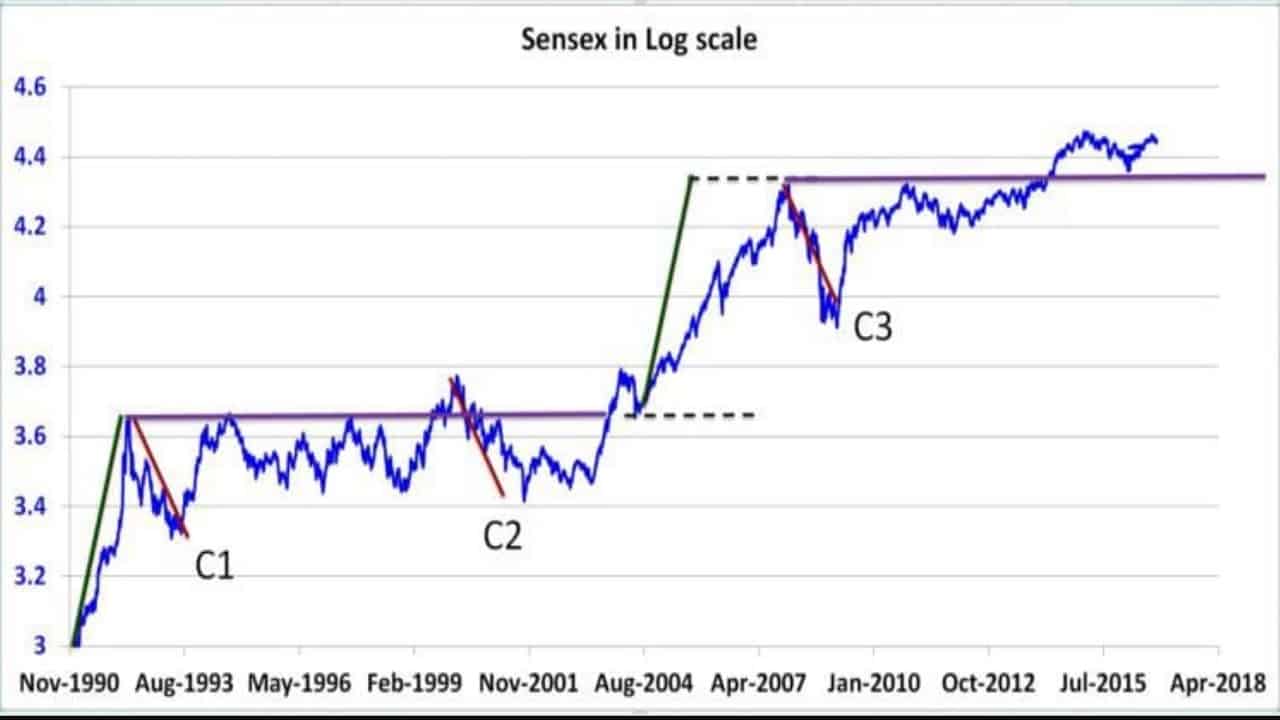
The Green lines First, let us look at the green line at the bottom left of the picture. It represents the bubble before the Harshad Mehta scam. For a good read on such market bubbles, see Review: Riding The Roller Coaster -Lessons from financial market cycles we repeatedly forget.
The increase in Sensex value over the course of this green took only one year! A leap from 3 to 3.6 (log) ~ 0.6(a little more).
Look at the second green line between the two dotted horizontal lines. This is the great bull in the 2000s. This increase is identical in magnitude to the Harshad Mehta bubble, except that it occurred over 3+ years. This is a simple illustration of the power of the log chart.
The Red lines, as you may have guessed, represent crashes. The Harshd Mehta scandal, the dot-com bust and the 2008 crash are similar in magnitude. A fact that the plain chart (top graph) cannot reveal.
The violet lines represent sideways markets. The first one lasted more than a decade. The second line is a projection in time.
The staircase pattern should be obvious now. Every big upward movement (so far) has resulted in a prolonged sideways market that would last for years. A fact that new equity investors should be aware of. This is why we must ask ourselves, am I ready to climb the Sensex Staircase?!
This is a log chart of the NASDAQ 100 Total Return in INR. See: What return can I expect from a 10-year SIP in the Nasdaq 100?
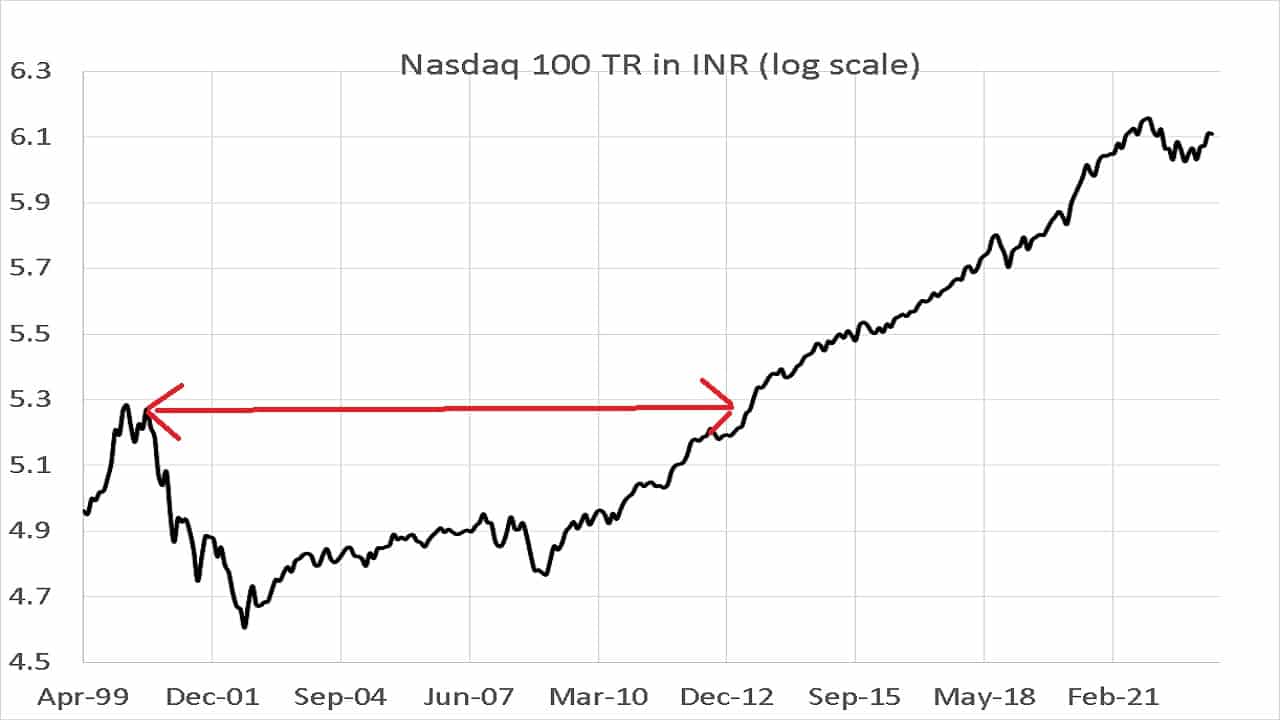
The area under the red arrow is about 15 years during the index was “underwater”. The log scale allows us to visualize this clearly and puts into perspective the recent fall compared to that during the dot-com crisis.
Do share this article with your friends using the buttons below.
🔥Enjoy massive discounts on our courses and robo-advisory tool! 🔥
Use our Robo-advisory Excel Tool for a start-to-finish financial plan! ⇐ More than 1000 investors and advisors use this!
New Tool! => Track your mutual funds and stocks investments with this Google Sheet!
- Follow us on Google News.
- Do you have a comment about the above article? Reach out to us on Twitter: @freefincal or @pattufreefincal
- Join our YouTube Community and explore more than 1000 videos!
- Have a question? Subscribe to our newsletter with this form.
- Hit ‘reply’ to any email from us! We do not offer personalized investment advice. We can write a detailed article without mentioning your name if you have a generic question.
Get free money management solutions delivered to your mailbox! Subscribe to get posts via email!
Explore the site! Search among our 2000+ articles for information and insight!
About The Author
 Dr M. Pattabiraman(PhD) is the founder, managing editor and primary author of freefincal. He is an associate professor at the Indian Institute of Technology, Madras. He has over nine years of experience publishing news analysis, research and financial product development. Connect with him via Twitter or Linkedin, or YouTube. Pattabiraman has co-authored three print books: (1) You can be rich too with goal-based investing (CNBC TV18) for DIY investors. (2) Gamechanger for young earners. (3) Chinchu Gets a Superpower! for kids. He has also written seven other free e-books on various money management topics. He is a patron and co-founder of “Fee-only India,” an organisation promoting unbiased, commission-free investment advice.
Our flagship course! Learn to manage your portfolio like a pro to achieve your goals regardless of market conditions! ⇐ More than 3000 investors and advisors are part of our exclusive community! Get clarity on how to plan for your goals and achieve the necessary corpus no matter what the market condition is!! Watch the first lecture for free! One-time payment! No recurring fees! Life-long access to videos! Reduce fear, uncertainty and doubt while investing! Learn how to plan for your goals before and after retirement with confidence.
Our new course! Increase your income by getting people to pay for your skills! ⇐ More than 700 salaried employees, entrepreneurs and financial advisors are part of our exclusive community! Learn how to get people to pay for your skills! Whether you are a professional or small business owner who wants more clients via online visibility or a salaried person wanting a side income or passive income, we will show you how to achieve this by showcasing your skills and building a community that trusts you and pays you! (watch 1st lecture for free). One-time payment! No recurring fees! Life-long access to videos!
Our new book for kids: “Chinchu gets a superpower!” is now available!

Most investor problems can be traced to a lack of informed decision-making. We have all made bad decisions and money mistakes when we started earning and spent years undoing these mistakes. Why should our children go through the same pain? What is this book about? As parents, what would it be if we had to groom one ability in our children that is key not only to money management and investing but to any aspect of life? My answer: Sound Decision Making. So in this book, we meet Chinchu, who is about to turn 10. What he wants for his birthday and how his parents plan for it and teach him several key ideas of decision making and money management is the narrative. What readers say!

Must-read book even for adults! This is something that every parent should teach their kids right from their young age. The importance of money management and decision making based on their wants and needs. Very nicely written in simple terms. – Arun.
Buy the book: Chinchu gets a superpower for your child!
How to profit from content writing: Our new ebook for those interested in getting side income via content writing. It is available at a 50% discount for Rs. 500 only!
Want to check if the market is overvalued or undervalued? Use our market valuation tool (it will work with any index!), or you buy the new Tactical Buy/Sell timing tool!
We publish monthly mutual fund screeners and momentum, low volatility stock screeners.
About freefincal & its content policy Freefincal is a News Media Organization dedicated to providing original analysis, reports, reviews and insights on mutual funds, stocks, investing, retirement and personal finance developments. We do so without conflict of interest and bias. Follow us on Google News. Freefincal serves more than three million readers a year (5 million page views) with articles based only on factual information and detailed analysis by its authors. All statements made will be verified from credible and knowledgeable sources before publication. Freefincal does not publish any paid articles, promotions, PR, satire or opinions without data. All opinions presented will only be inferences backed by verifiable, reproducible evidence/data. Contact information: letters {at} freefincal {dot} com (sponsored posts or paid collaborations will not be entertained)
Connect with us on social media
Our publications
You Can Be Rich Too with Goal-Based Investing
 Published by CNBC TV18, this book is meant to help you ask the right questions and seek the correct answers, and since it comes with nine online calculators, you can also create custom solutions for your lifestyle! Get it now.
Gamechanger: Forget Startups, Join Corporate & Still Live the Rich Life You Want
 This book is meant for young earners to get their basics right from day one! It will also help you travel to exotic places at a low cost! Get it or gift it to a young earner.
Your Ultimate Guide to Travel
 This is an in-depth dive analysis into vacation planning, finding cheap flights, budget accommodation, what to do when travelling, and how travelling slowly is better financially and psychologically with links to the web pages and hand-holding at every step. Get the pdf for Rs 300 (instant download)


