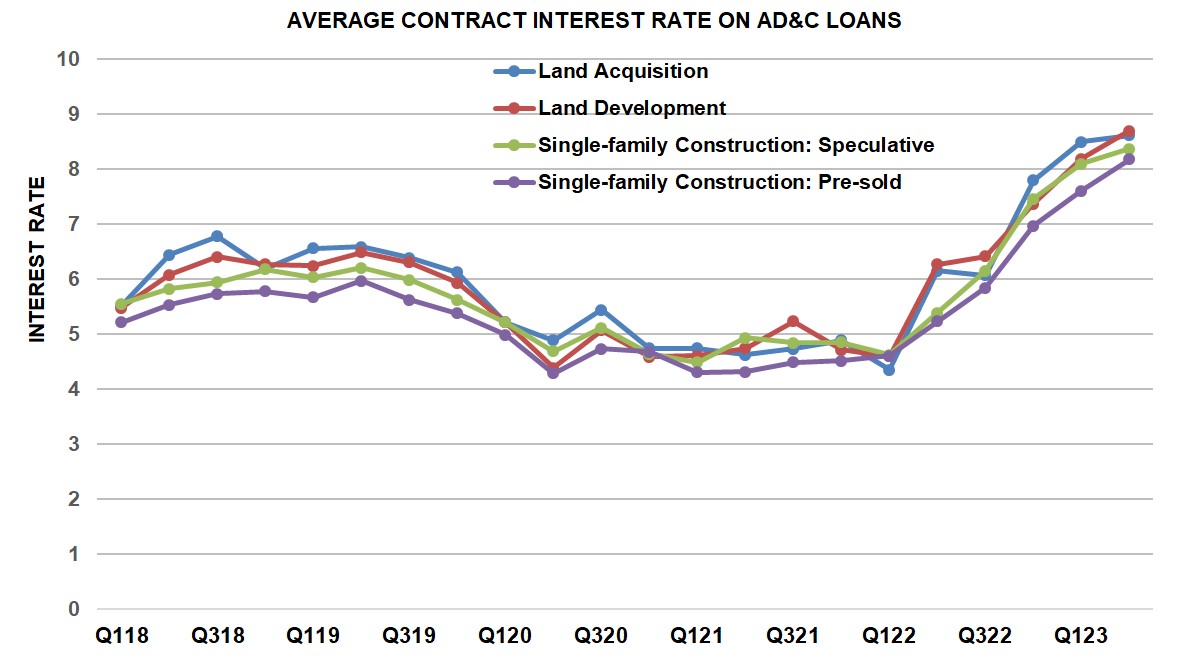
Interest rates on loans for Acquisition, Development & Construction (AD&C) continued to climb in the second quarter of 2023, according to NAHB’s quarterly Survey on AD&C Financing. Quarter-over-quarter, the contract interest rate increased on all four categories of loans tracked in the AD&C Survey: from 8.50% to 8.62% on loans for land acquisition, from 8.19% to 8.70% on loans for land development, from 8.10% to 8.37% on loans for speculative single-family construction, and from 7.61% to 8.18% on loans for pre-sold single-family construction. In all four cases, the contract interest rate was higher in 2023 Q2 than it had been at any time since NAHB began collecting the data in 2018. The rates have been climbing steadily every quarter since the start of 2022 with one minor exception (for land acquisition loans in the third quarter of 2022).

Meanwhile, the average initial points charged on the loans actually declined in the second quarter: from 0.81% to 0.52% on land development loans, from 0.85% to 0.81% on land acquisition loans, from 0.79% to 0.71% for speculative single-family construction, and from 0.53% to 0.44% on loans for pre-sold single-family construction.
Only in the case of land acquisition, however, was the decline in initial points large enough to offset the contract interest rate and reduce the average effective rate (the rate of return to the lender over the assumed life of the loan, taking both the contract interest rate and initial points into account) paid by developers: from 11.09% in the first quarter to 10.87%. On the other three categories of AD&C loans, the average effective rate continued to climb, much as it had over the previous year: from 11.88% to 12.67% on loans for land development, from 12.59% to 12.85% on loans for speculative single-family construction, and from 12.01% to 12.67% on loans for pre-sold single-family construction.
The NAHB AD&C financing survey also collects data on credit availability. To help interpret these data, NAHB generates a net easing index, similar to the net easing index based on the Federal Reserve’s survey of senior loan officers. Plotting the two indices on a single graph lets viewers compare what both the borrowers and lenders are saying about current credit conditions.

In the second quarter of 2023, both the NAHB and Fed indices were slightly less negative than they had been in the first quarter, but still solidly in negative territory, indicating net tightening of credit. The NAHB net easing index posted a reading of -35.3, compared to -36.0 in the first quarter. And the Fed net easing index posted a reading of -71.7, compared to -73.3 in the first quarter. This marks the sixth consecutive quarter during which both borrowers and lenders have been reporting tightening credit conditions.
More detail on current credit conditions for builders and developers is available on NAHB’s AD&C Financing web page.
Related


