
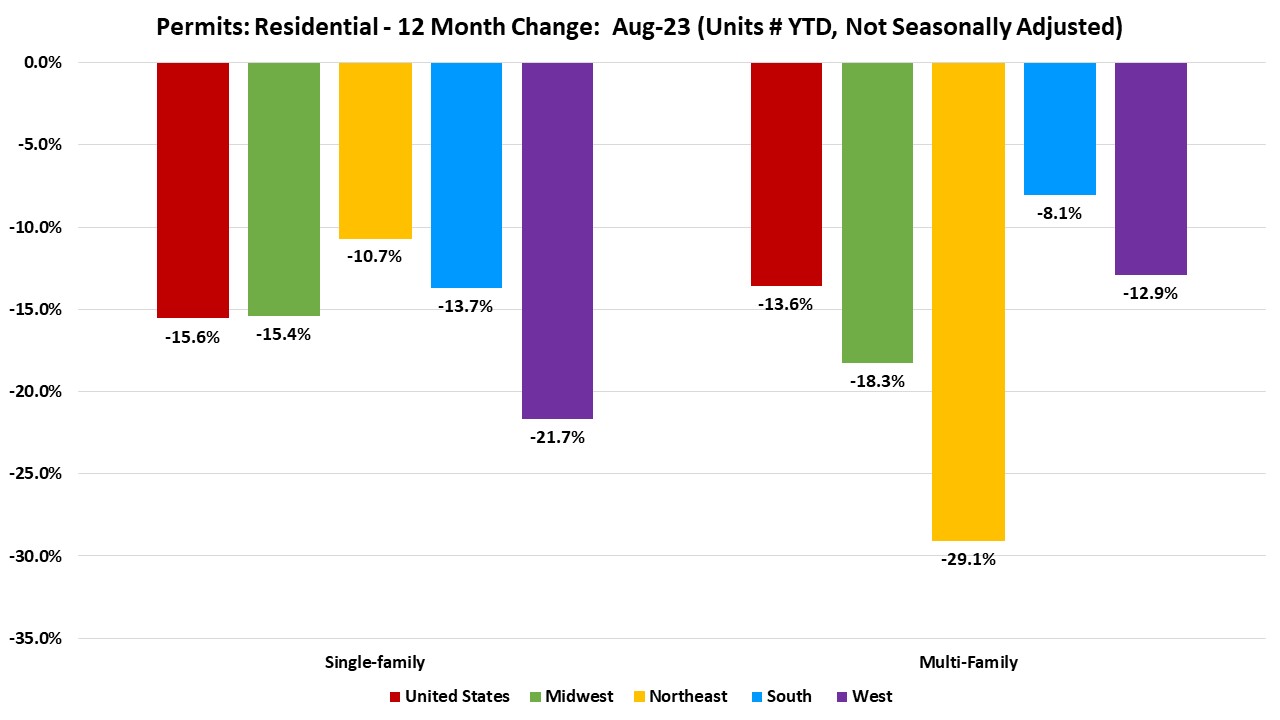
Over the first eight months of 2023, the total number of single-family permits issued year-to-date (YTD) nationwide reached 615,453. On a year-over-year (YoY) basis, this is 15.6% below the August 2022 level of 728,866.

Year-to-date ending in August, single-family permits declined in all four regions. The range of permit decline spanned 10.7% in the Northeast to 21.7% in the West. The South declined by 13.7% and the Midwest declined by 15.4% in single-family permits during this time. For multifamily permits, the percentage decline spanned 8.1% in the South region to 29.1% in the Northeast. The West declined by 12.9% and the Midwest declined by 18.3% in multifamily permits during this time.
Between August 2022 YTD and August 2023 YTD, except for Hawaii (+16.8%) and Maryland (+5.2%), all the other states and the District of Columbia reported declines in single-family permits. The range of declines spanned 4.8% in New Jersey to 50.0% in Alaska. The ten states issuing the highest number of single-family permits combined accounted for 63.9% of the total single-family permits issued. Texas, the state with the highest number of single-family permits issued, declined 16.7% in the past 12 months while the next two highest states, Florida and North Carolina declined by 15.8% and 8.8% respectively.

Year-to-date, ending in August, the total number of multifamily permits issued nationwide reached 394,257. This is 13.6% below the August 2022 level of 456,244.
Between August 2022 YTD and August 2023 YTD, 16 states recorded growth, while 34 states and the District of Columbia recorded a decline in multifamily permits. Delaware (+145.5%) led the way with a sharp rise in multifamily permits from 1220 to 540 while Wyoming had the largest decline of 75.9% from 519 to 125. The ten states issuing the highest number of multifamily permits combined accounted for 64.1% of the multifamily permits issued. Texas, the state with the highest number of multifamily permits issued, declined 19.3% in the past 12 months while the next two highest states, Florida declined by 0.8% and California increased by 7.1%.

At the local level, below are the top ten metro areas that issued the highest number of single-family permits.
| Top 10 Largest SF Markets | Aug-23 (# of units YTD, NSA) | YTD % Change (compared to Aug-22) |
| Houston-The Woodlands-Sugar Land, TX | 34,841 | -3% |
| Dallas-Fort Worth-Arlington, TX | 28,282 | -15% |
| Atlanta-Sandy Springs-Roswell, GA | 16,894 | -14% |
| Phoenix-Mesa-Scottsdale, AZ | 15,889 | -27% |
| Charlotte-Concord-Gastonia, NC-SC | 12,956 | -9% |
| Orlando-Kissimmee-Sanford, FL | 11,734 | -3% |
| Austin-Round Rock, TX | 10,925 | -35% |
| Nashville-Davidson–Murfreesboro–Franklin, TN | 9,897 | -14% |
| Tampa-St. Petersburg-Clearwater, FL | 9,578 | -17% |
| Raleigh, NC | 8,726 | -8% |
For multifamily permits, below are the top ten local areas that issued the highest number of permits.
| Top 10 Largest MF Markets | Aug-23 (# of units YTD, NSA) | YTD % Change (compared to Aug-22) |
| New York-Newark-Jersey City, NY-NJ-PA | 21,605 | -40% |
| Dallas-Fort Worth-Arlington, TX | 17,291 | -23% |
| Houston-The Woodlands-Sugar Land, TX | 14,057 | -22% |
| Austin-Round Rock, TX | 13,999 | -18% |
| Los Angeles-Long Beach-Anaheim, CA | 13,324 | -1% |
| Phoenix-Mesa-Scottsdale, AZ | 12,688 | 4% |
| Miami-Fort Lauderdale-West Palm Beach, FL | 12,685 | 41% |
| Atlanta-Sandy Springs-Roswell, GA | 11,583 | -12% |
| Washington-Arlington-Alexandria, DC-VA-MD-WV | 8,669 | -31% |
| Nashville-Davidson–Murfreesboro–Franklin, TN | 8,388 | 191% |
Related
