The Reserve Bank of India (RBI) has released the latest volume (25th edition) of its annual statistical publication, ‘Handbook of Statistics on the Indian Economy – (2022-23) on 15th Sep 2023. Through this publication, the Reserve Bank has been providing time series data on various Economic and Financial indicators for the Indian economy.
In this annual publication, we can find lot of useful data related to;
- Macro Economic indicators
- Money & Banking
- Financial Markets
- Public Finances
- Trade & Balance of payments
- Socio & Economic indicators and so on..
Based on this statistical data, I have been collating and publishing (since 2014) some important / interesting points and trends related to Personal Finances like – Indian Household Savings Pattern, total investments in bank deposits, investments in shares & mutual funds, information on total bank loans, performance of Share markets, Inflation data, NRI deposits, Deposit & Lending interest rates pattern etc.,
Before discussing the facts & figures, let us understand – what are household savings, Financial Assets and Physical Assets?
Households’ Savings correspond to the total income saved by households during a certain period of time. Savings and investments in banks, stock markets, Post office schemes, company deposits etc., are considered as Financial Assets / Financial Savings. Investments in properties (real estate), gold, silver etc., are Physical Savings / Physical Assets.
Indian Household Savings, Investments & Liabilities Pattern 2022-23
Financial Assets Vs Physical Assets : Which are our preferred Assets?
- From 1990 to 2000, Indian households preferred to invest in Financial assets to Physical assets.
- From 2000 to 2007, more savings were routed to Physical assets.
- Interestingly in 2007/08, more investments were made in Financial assets. This shows that retails/small investors participated in stock markets when their valuations were at peak. The markets eventually crashed in 2008.
- From 2008 to till 2015, we preferred physical savings to financial savings.
- The Gross Domestic Savings of household sector have seen a considerable increase from Rs 3296596 crore in 2017-18 to Rs 4619501 crore in 2021-22.
- The Gross Financial Savings during 2017-18, 2018-19, 2019-20, 2020-21 & 2021-22 were Rs 2056405 crore, Rs 2263690 crore, Rs 2324563 crore, Rs 3054391 Cr & Rs 2597909 crore.
“We can notice that the gross financial savings of Indian Household decreased drastically when we compare the data of 2020-21 Vs 2021-22.”
- The savings in Physical Assets were around Rs 2309463 crore, Rs 2252167 crore, Rs 2119353 crore & Rs 2769044 crore during 2018-19, 2019-20, 2020-21 & 2021-22 respectively.
- The savings in Physical assets have seen a steep increase in 2021-22.
- We can notice that the savings in physical assets slightly dipped during covid phase from 201-20 to 2021-22.
- The above recent years data indicate that there has been an uptick of savings in Physical Assets and downtick in Financial Assets in 2021-22 when compared to the figures of 2020-21. The savings in physical assets outscored the savings in Financial securities in 2021-22 as well.
- Saving in the form of gold and silver ornaments has increased drastically from Rs 38446 crore in 2020-21 to Rs 59675 crore in 2021-22.
Financial Assets (Savings) of the Households (2012-2022)

- The Savings in banking deposits and life insurance have seen a decent fall and savings in non-banking deposits (like company fixed deposits), Public Provident Fund and Shares have seen significant increase.
- The Indian household investments in Shares and debentures have doubled in 2021-22 when compared to 2020-21 data.
Financial Liabilities of Indian Households (2022)
- The total Financial liabilities (loans & advances) of the Indian household sector were around Rs 807127 crore in 2021-22.
- This figure was around Rs 777517 crore for the FY 2020-21. So, the financial liabilities of Indian households have increased by almost 38% in 2022.
- Loans taken from Banks during 2018-19, 2019-20, 2020-21 & 2021-22 were Rs 604511 cr, Rs 509958 cr, Rs 639963 and Rs 708092 respectively.
- The loans taken from other financial institutions (non-banking) during 2018-19, 2019-20, 2020-21 & 2021-22 were Rs 166188 cr, Rs 264735 cr, Rs 138156 and Rs 98737 respectively. We can notice a big fall in advances from non-banking sector in 2021-22.
- The total Home loans outstanding with HDFC are around Rs 616039 cr till 2022-23 (provisional data).
“On June 30, the Boards of HDFC Limited and HDFC Bank approved the effective date of merger as July 1, 2023.”
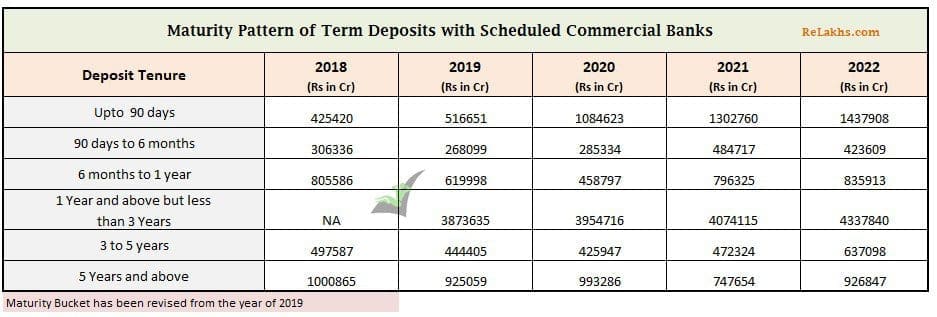
Savings in Bank Fixed Deposits
The below table gives you an idea about the total outstanding amount saved in Bank Term Deposits based and the tenure of the deposits. Except Term deposits of 90 days to 6 months duration, all other time deposits have shown a positive pattern during 2022-23.
Bank Deposits by NRIs
Below are the outstanding NRI Bank Deposits (in crores) from 2015 to 2022;
| Year | NRE Deposits | FCNR Deposits | NRO Deposits |
|---|---|---|---|
| 2015 | 392832 | 268106 | 60059 |
| 2016 | 474068 | 300593 | 67294 |
| 2017 | 539544 | 136173 | 82033 |
| 2018 | 585625 | 143264 | 91848 |
| 2019 | 636491 | 160271 | 105390 |
| 2020 | 676338 | 181451 | 119521 |
| 2021 | 742720 | 148235 | 136428 |
| 2022 | 767881 | 128879 | 162281 |
| 2023 | 787776 | 159199 | 194842 |
There has been a steady increase of outstanding deposits by NRIs in NRE & NRO accounts since 2015 to 2023 (provisional).
Interest Rates pattern of Bank Deposits (2012 to 2023)
Below table gives us an idea about the deposit rates and lending rates pattern in India over the last 12 years.
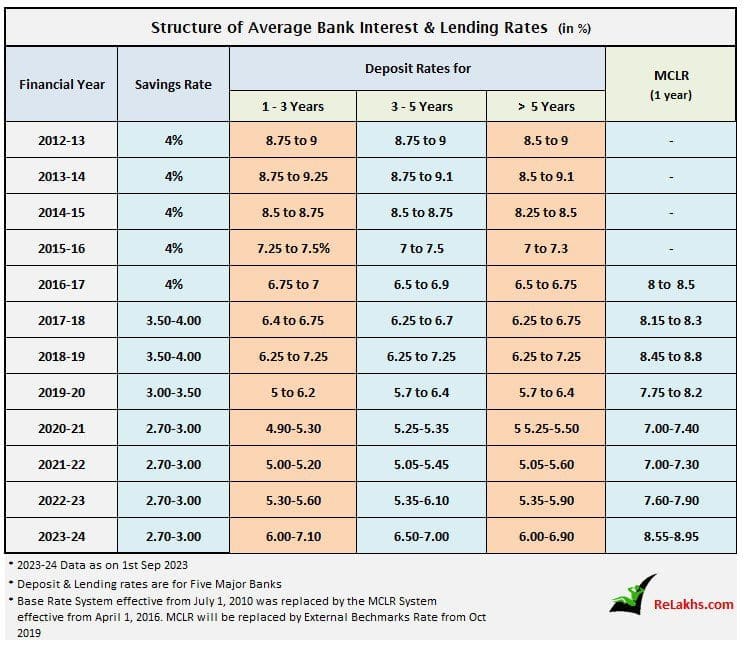
The interest rates on deposits and loans have been increasing in the last couple of years.
Deposits in Post office Small Savings Schemes (SSS)
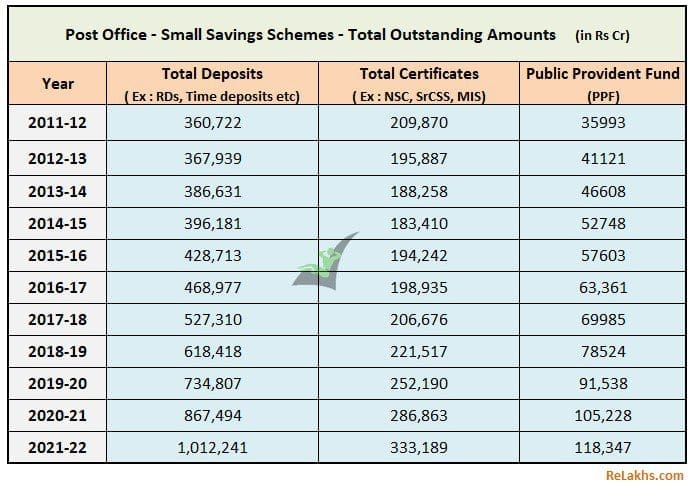
- Indian households’ savings in Post office time deposits and PPF have been increasing steadily since 2011.
- During 2012-16 there has been a decline in investments in NSCs, KVP certificates and other popular schemes like Senior Citizen Savings Schemes or Monthly Income Scheme (MIS), however this trend was reversed during 2016-18.
Mutual Fund Schemes : Assets Under Management till 2023
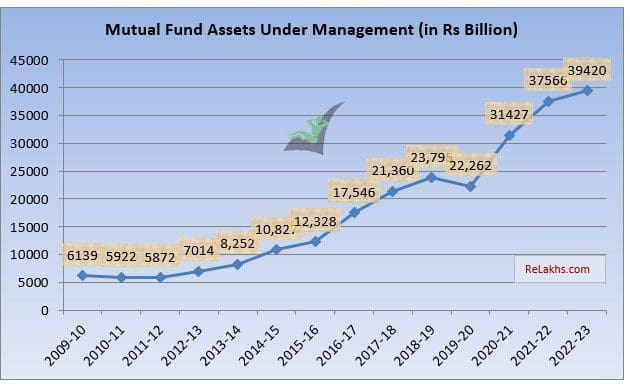
There has been around 7% decline in AUM of Mutual Funds in India during 2019-20 due to covid impact. However, the stock markets have recovered well during the last three years and hence we can notice the study raise in the AUM of the mutual fund houses.
Other important observations
- Inflation : The CPI (consumer Price Index), which is popularly known as INFLATION has gradually increased during the FY 2022-23.
- The population in India is around 138 crores.
- Investments by LIC : LIC has invested around Rs 3898997 cr in Stock-exchange securities during 2022-2023 (an increase of around 10%). During 2021-22, LIC had invested around Rs 3539141 cr.
- NBFC Deposits : The total outstanding public deposits with NBFCs were around Rs 70754 cr and Rs 85256 cr for 2021-22 and 2022-23 respectively.
- An interesting observation is – the number of reporting NBFCs have further declined from 69 in 2019-20 to just 34 in 2022-23.
- Income Tax Revenue Collection : The Central Govt had collected Personal income tax to the tune of Rs 582516 cr during AY 2023-24, up from Rs 527616 cr in AY 2022-23.
- Share Market Indices: The annual average of share price index of BSE Sensex was 58307 for FY 2022-23. The total market capitalization of BSE was valued at Rs 25819896 cr.
- The average gold price in Mumbai market was around Rs 52730 per 10 gm during the FY 2022-23 and that of Silver was around Rs 61990 per kg.
- CRR & Repo Rates : The RBI has been keeping the key policy rates on hold. The latest rates as of 22-may-2020 are – CRR @ 4.5%, SLR @ 18%, Repo rate @ 6.5% and Reverse-repo rate @ 3.35%. (Read : ‘What is CRR/SLR/Repo rate?‘)
- Bank Deposits & Insurance: The total claim amount under DICGC was around Rs 4103 cr during FY 2022-23. (Read : What happens to your FDs, deposits if bank fails?)
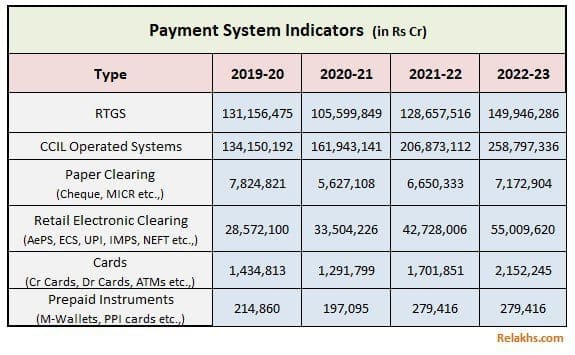
- Electronic Payment System : The FY 2022-23 saw a huge increase in total digital payments (value) from Rs 174401233 cr to Rs 208684872 cr.
My Opinion:
Though there has been an increase in equity and other financial investments, the savings in physical assets like real-estate still beat the financial savings by a decent margin. But the tech savvy and new generation has been lapping up the mutual fund and stock investments in the last couple of years. This is an encouraging sign. In the last couple of financial years, the Mutual funds have witnessed sharp rise in the savings with households preferring both debt and equity schemes.
Covid did lead to households pitching for life insurance and hence the share of this component has gone up in 2020 but the trend did not last in 2021-22. The penetration levels with respect to both life insurance and non-life insurance are still on the lower side and there is a huge opportunity for the insurance companies to tap into this market.
We may also see RBI increasing key policy rates to control the inflation in the remaining part of the FY 2023-24 thus leading to higher deposit and lending rates.
The Savings rate in India has been on a decline and the household’s dependency on loans have been constantly increasing. The young people are spending more than their previous generation and thus leading to lower savings rate and this trend may continue in the near future.
I hope you find this post informative and useful. Where do you save and invest? Which are your preferred investment avenues? Kindly share your views and comments!
Continue reading:
(Post first published on : 16-Sep-2023)


