

Home prices experienced a third year-over-year deceleration in May, according to the S&P CoreLogic Case-Shiller U.S. National Home Price Index. On a year-over-year basis, the non-seasonally adjusted (NSA) index posted a 5.94% annual gain in May, down from a 6.39% increase in April. Since June of 2023, the index had seen steady increases in the year-over-year growth rate. However, this growth rate began slowing in March of 2024, and has continued to decelerate through May.
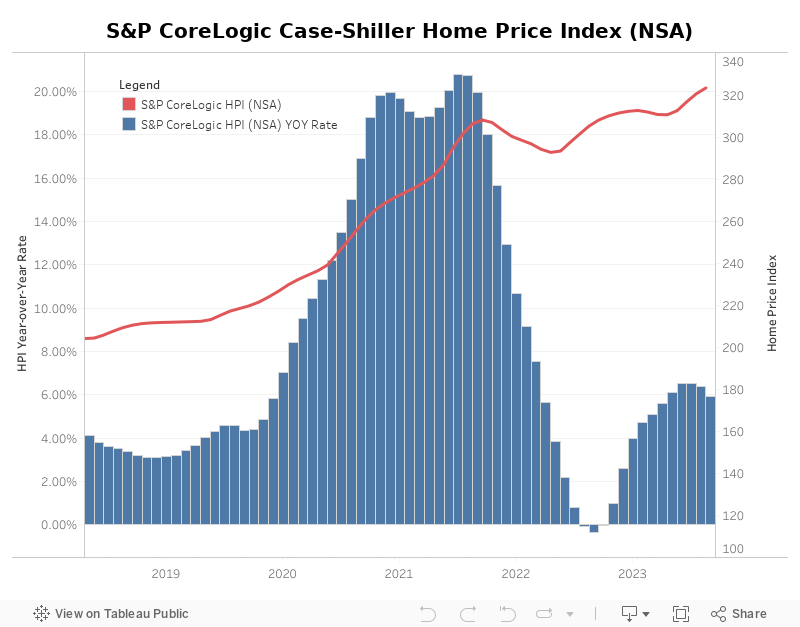
The S&P CoreLogic Case-Shiller U.S. National Home Price Index (HPI) increased at a seasonally adjusted annual rate of 3.09% for May. This was following a revised rate of 3.91% in April. May marks the 16th consecutive monthly increase; home prices have not seen an outright decrease since January of 2023.
FHFA HPI
Meanwhile, the Home Price Index released by the Federal Housing Finance Agency (FHFA; NSA), has also seen year-over year growth deceleration for the third consecutive month. For May, the index rose 5.79%, down from 6.61% in April. It has decelerated from a 7.17% rate in February.
On a seasonally adjusted basis, the index saw a declined at an annual rate of -0.34% for May, decreasing from a revised 4.16% rate in April. The FHFA Index has experienced just one other decrease since August of 2022, with a decline of -1.03% in January 2024.
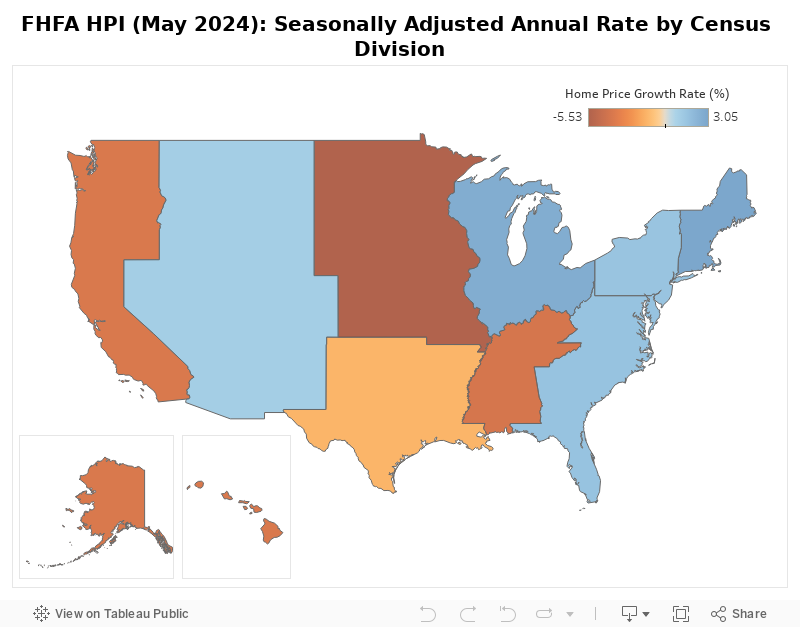
By Census Division
Monthly, the FHFA HPI (SA) releases not only national data but by census division reporting as well. Out of the nine census divisions, four posted negative monthly depreciation (adjusted to an annual rate) for May: West North Central (-5.53%), East South Central (-4.00%), the Pacific (-3.82%), and West South Central (-1.36%). The remaining five divisions with positive home price appreciation ranged from 1.01% in the Mountain division to 3.05% in the New England division. The FHFA HPI releases their metro and state data on a quarterly basis, which NAHB analyzes on a previous post.
By Metro Area
In addition to tracking national home price changes, the S&P CoreLogic Index (NSA) also reported home price indexes across 20 metro areas in May. At an annual rate, three out of 20 metro areas reported home price declines: Phoenix at -6.56%, Portland at -4.99%, and Dallas at -0.73%. Among the 20 metro areas, ten exceeded the national rate of 3.09%. Detroit had the highest rate at 10.70%, followed by New York at 9.76%, and then Cleveland at 8.40%.
Discover more from Eye On Housing
Subscribe to get the latest posts sent to your email.
