

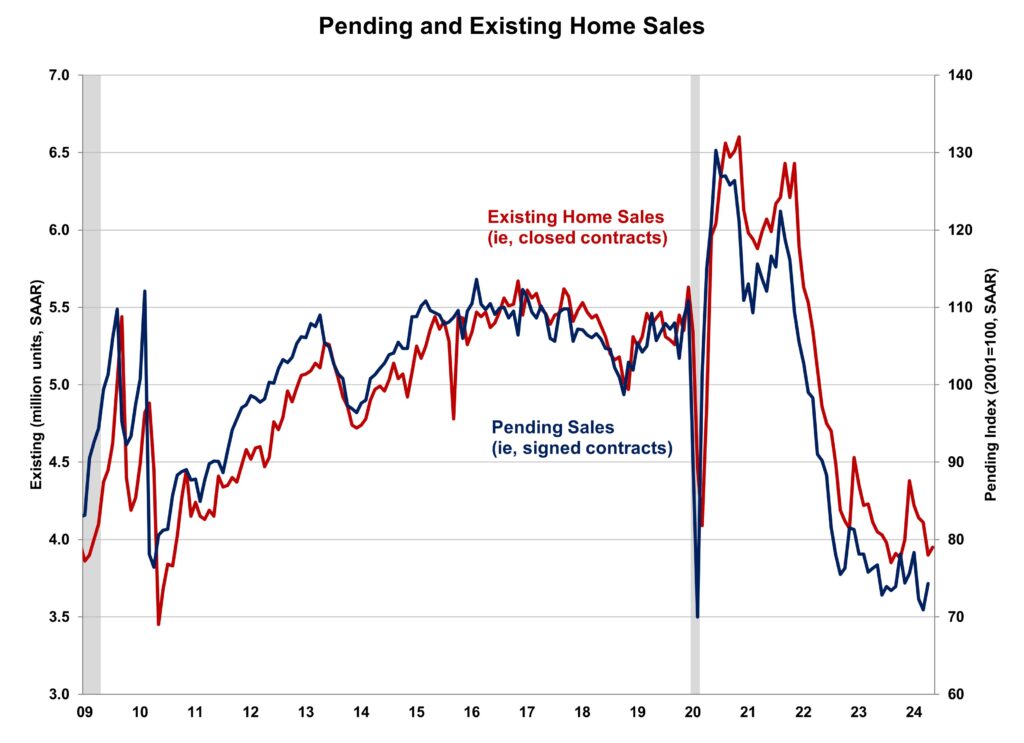
Existing home sales increased for the first time in five months, according to the National Association of Realtors (NAR), as improving inventory and declining mortgage rates motivated some buyers to act. Despite these changes, sales remained sluggish and low inventory continued to push up median home prices. However, we expect increased activity in the coming months as mortgage rates continue to moderate. Improving inventory is likely to ease home price growth and enhance affordability.
Homeowners with lower mortgage rates have opted to stay put, avoiding trading existing mortgages for new ones with higher rates. This trend is driving home prices higher and holding back inventory. Mortgage rates are expected to continue to decrease gradually, leading to increased demand (and unlocking lock-in inventory) in the coming quarters. However, that decline is dependent on future inflation and job reports, and especially possible easing by the Federal Reserve.
Total existing home sales, including single-family homes, townhomes, condominiums, and co-ops, rose 1.3% to a seasonally adjusted annual rate of 3.95 million in July. This marks the first increase after four months of declines. On a year-over-year basis, sales were still 2.5% lower than a year ago.

The first-time buyer share stayed at 29% in July, identical to June but down from 30% in July 2023. The inventory level rose from 1.32 million in June to 1.33 million units in July and is up 19.8% from a year ago.
At the current sales rate, July unsold inventory sits at a 4.0-months supply, down from 4.1-months last month but up from 3.3-months a year ago. This inventory level remains low compared to balanced market conditions (4.5 to 6 months’ supply) and illustrates the long-run need for more home construction. However, the count of single-family resale homes available for sale is up almost 19.1% on a year-over-year basis.
Homes stayed on the market for an average of 24 days in July, up from 22 days in June and 20 days in July 2023.
The July all-cash sales share was 27% of transactions, down from 28% in June but up from 26% a year ago. All-cash buyers are less affected by changes in interest rates.
The July median sales price of all existing homes was $422,600, up 4.2% from last year. This marked the 13th consecutive month of year-over-year increases. The median condominium/co-op price in July was up 2.7% from a year ago at $367,500. This rate of price growth will slow as inventory increases.
Existing home sales in July were mixed across the four major regions. In the Northeast, South, and West, sales increased by 4.3%, 1.1%, and 1.4%, respectively, while sales in the Midwest remained unchanged. On a year-over-year basis, sales rose in the Northeast (2.1%) and West (1.4%) but fell in the Midwest (-5.2%) and South (-3.8%).

The Pending Home Sales Index (PHSI) is a forward-looking indicator based on signed contracts. The PHSI rose from 70.9 to 74.3 in June as inventory improved. On a year-over-year basis, pending sales were 2.6% lower than a year ago per NAR data.
Discover more from Eye On Housing
Subscribe to get the latest posts sent to your email.
