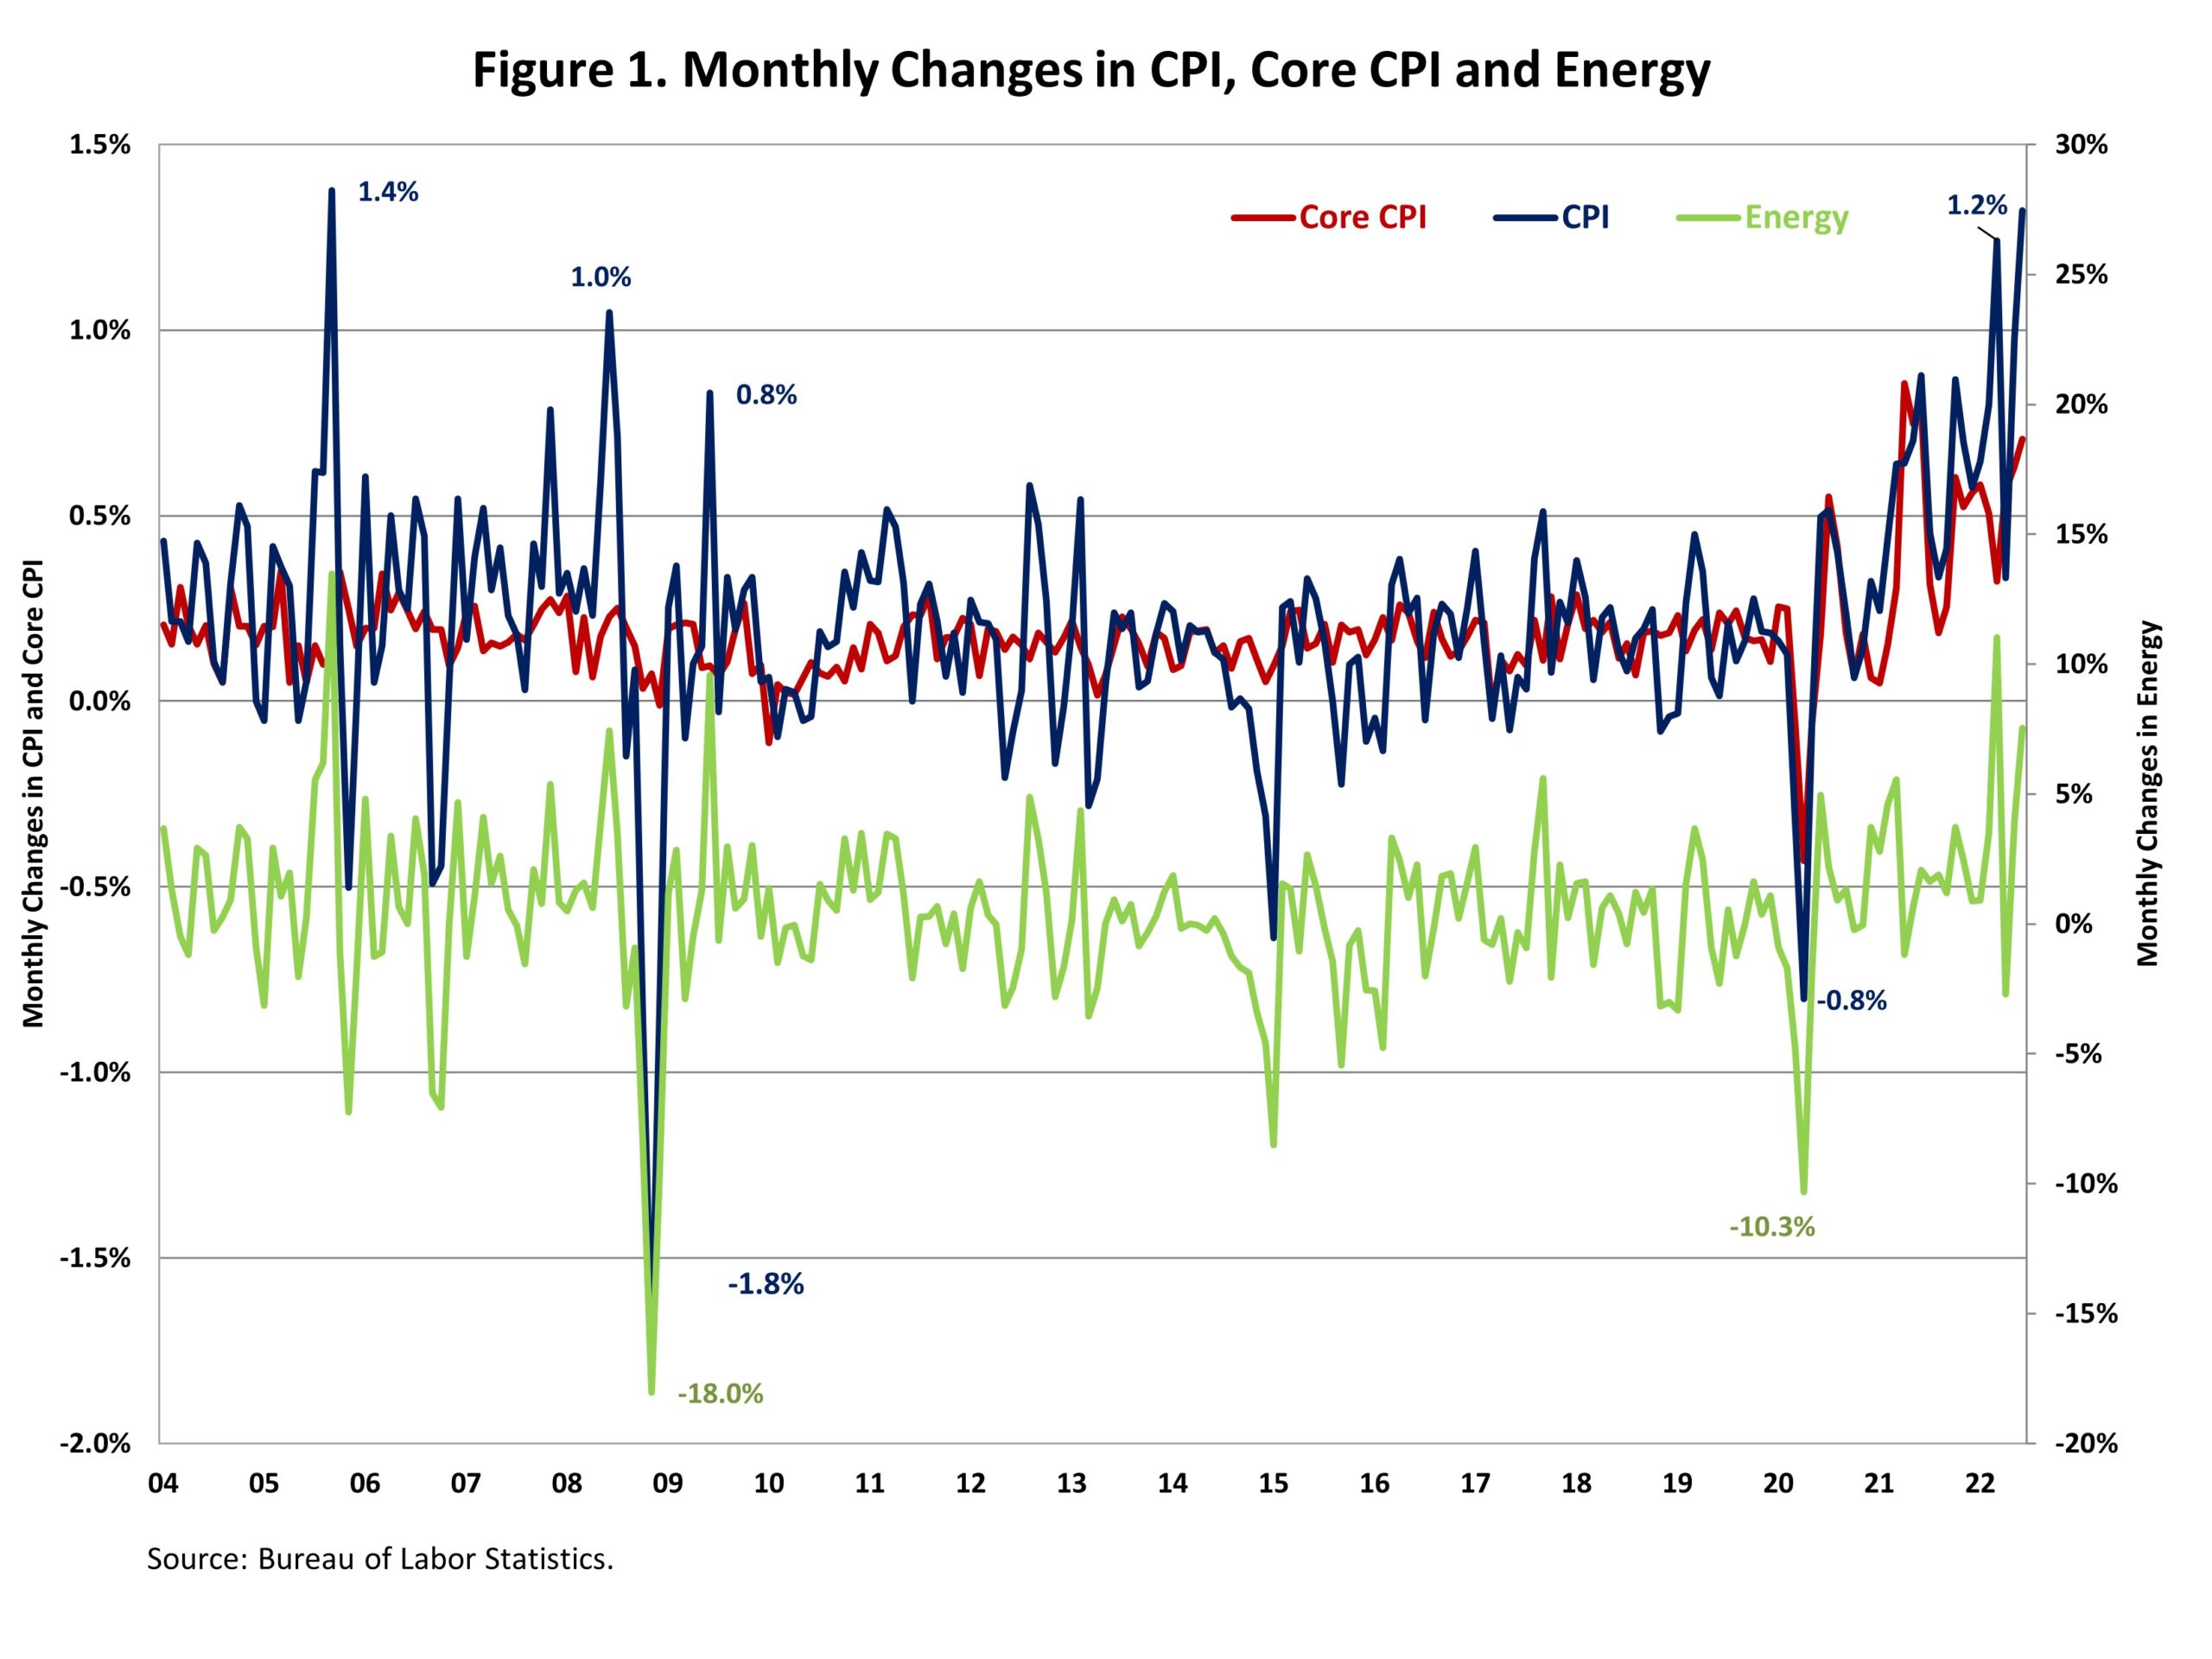
Consumer prices reached a new 40-year high in June as shelter, energy and food prices continued to surge at the fastest pace in decades. This marked the fourth straight month for inflation above an 8% rate and was the largest year-over-year gain since November 1981. Both energy and shelter index recorded their largest annual gains since April 1980 and February 1991. This persistent inflation is likely to push the Federal Reserve to continue tightening monetary policy and raise rates at an accelerated pace. At this stage, it appears that a 75 basis point increase is the floor for the next Fed move on the fed funds rate.
The Bureau of Labor Statistics (BLS) reported that the Consumer Price Index (CPI) rose by 1.3% in June on a seasonally adjusted basis, following an increase of 1.0% in May. This was the largest monthly increase since September 2005. Excluding the volatile food and energy components, the “core” CPI increased by 0.7% in June, following an increase of 0.6% in the past two months.
While the increase was broad-based, the indexes for gasoline, shelter, and food were the largest contributors to the increase in the headline CPI in June. After rising 3.9% in May, the energy index rose by 7.5% in June with the gasoline and natural gas index rising 11.2% and 8.2%, the largest monthly increase in natural gas index since October 2005. Meanwhile, both food and food at home index rose by 1.0% in June.
Other major component indexes also continued to rise in June. The indexes for shelter (+0.6%), used cars and trucks (1.6%), medical care (0.7%), motor vehicle insurance (1.9%) and new vehicles (0.7%).
The index for shelter, which makes up more than 40% of the “core” CPI, rose by 0.6% in June, the same increase as in May. The indexes for owners’ equivalent rent (OER) increased by 0.7% and rent of primary residence (RPR) increased by 0.8% over the month, the largest monthly increase since April 1986. Monthly increases in OER have averaged 0.6% over the last three months. More cost increases are coming from this category, which will add to inflationary forces in the months ahead. These higher costs are driven by lack of supply and higher development costs. Higher interest rates will not slow these costs, which means the Fed’s tools are limited in addressing shelter inflation.
During the past twelve months, on a not seasonally adjusted basis, the CPI rose by 9.1% in June, following an 8.6% increase in May. The “core” CPI increased by 5.9% over the past twelve months, following a 6.0% increase in May. The food index rose by 10.4% and the energy index climbed by 41.6% over the past twelve months.
NAHB constructs a “real” rent index to indicate whether inflation in rents is faster or slower than overall inflation. It provides insight into the supply and demand conditions for rental housing. When inflation in rents is rising faster (slower) than overall inflation, the real rent index rises (declines). The real rent index is calculated by dividing the price index for rent by the core CPI (to exclude the volatile food and energy components).
The Real Rent Index rose by 0.1 in June. Over the first six months of 2022, the monthly change of the Real Rent Index stayed virtually unchanged, on average.
Related


